很久之前曾經總結過一篇博客“MySQL如何找出未提交事務信息”,現在看來,這篇文章中不少知識點或觀點都略顯膚淺,或者說不夠深入,甚至部分結論是錯誤的。下面重新探討一下這個話題。那么我們還是以之前的例子來介紹。
--準備測試環境數據(實驗環境為MySQL 8.0.18社區版)
mysql> create table kkk(id int , name varchar(12));
Query OK, 0 rows affected (0.34 sec)

mysql> insert into kkk values(1, 'kerry');
Query OK, 1 row affected (0.01 sec)

mysql> insert into kkk values(2, 'jerry');
Query OK, 1 row affected (0.00 sec)

mysql> insert into kkk values(3, 'ken');
Query OK, 1 row affected (0.00 sec)

mysql>

mysql> create table t(a varchar(10));
Query OK, 0 rows affected (0.47 sec)

mysql> insert into t values('test');
Query OK, 1 row affected (0.00 sec)
在一個會話窗口(連接ID=38)執行下面SQL
mysql> select connection_id() from dual;
+-----------------+
| connection_id() |
+-----------------+
|  38 |
+-----------------+
1 row in set (0.00 sec)

mysql> set session autocommit=0;
Query OK, 0 rows affected (0.00 sec)

mysql> delete from kkk where id =1;
Query OK, 1 row affected (0.00 sec)

mysql>
在另外一個會話窗口(連接ID=39)執行下面SQL
mysql> SELECT t.trx_mysql_thread_id
 -> ,t.trx_id
 -> ,t.trx_state
 -> ,t.trx_tables_in_use
 -> ,t.trx_tables_locked
 -> ,t.trx_query
 -> ,t.trx_rows_locked
 -> ,t.trx_rows_modified
 -> ,t.trx_lock_structs
 -> ,t.trx_started
 -> ,t.trx_isolation_level
 -> ,p.time
 -> ,p.user
 -> ,p.host
 -> ,p.db
 -> ,p.command
 -> FROM information_schema.innodb_trx t
 -> INNER JOIN information_schema.processlist p
 ->  ON t.trx_mysql_thread_id = p.id
 -> WHERE t.trx_state = 'RUNNING'
 -> AND p.time > 4
 -> AND p.command = 'Sleep'\G
*************************** 1. row ***************************
trx_mysql_thread_id: 38
  trx_id: 7981581
  trx_state: RUNNING
 trx_tables_in_use: 0
 trx_tables_locked: 1
  trx_query: NULL
 trx_rows_locked: 4
 trx_rows_modified: 1
 trx_lock_structs: 2
 trx_started: 2020-12-03 15:39:37
trx_isolation_level: REPEATABLE READ
  time: 23
  user: root
  host: localhost
   db: MyDB
  command: Sleep
1 row in set (0.00 sec)
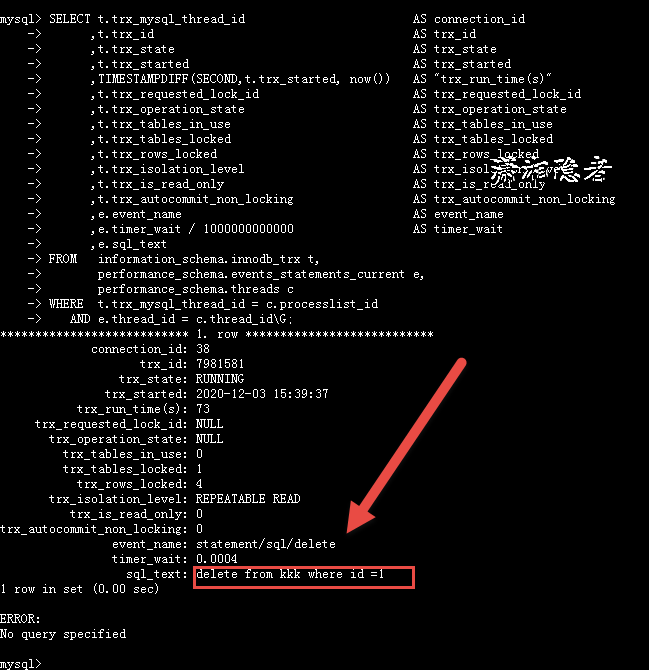
雖然上面這個SQL找不出事務執行過的SQL,其實呢,MySQL中未提交事務的最后執行的一個SQL是可以通過下面腳本準確查找出來的。如下所示:
SELECT t.trx_mysql_thread_id   AS connection_id
 ,t.trx_id     AS trx_id
 ,t.trx_state     AS trx_state
 ,t.trx_started    AS trx_started
 ,TIMESTAMPDIFF(SECOND,t.trx_started, now()) AS "trx_run_time(s)"
 ,t.trx_requested_lock_id   AS trx_requested_lock_id
 ,t.trx_operation_state   AS trx_operation_state
 ,t.trx_tables_in_use    AS trx_tables_in_use
 ,t.trx_tables_locked    AS trx_tables_locked
 ,t.trx_rows_locked    AS trx_rows_locked
 ,t.trx_isolation_level   AS trx_isolation_level
 ,t.trx_is_read_only    AS trx_is_read_only
 ,t.trx_autocommit_non_locking   AS trx_autocommit_non_locking
 ,e.event_name     AS event_name
 ,e.timer_wait / 1000000000000   AS timer_wait
 ,e.sql_text
FROM information_schema.innodb_trx t,
 performance_schema.events_statements_current e,
 performance_schema.threads c
WHERE t.trx_mysql_thread_id = c.processlist_id
 AND e.thread_id = c.thread_id\G;
如下截圖所示:
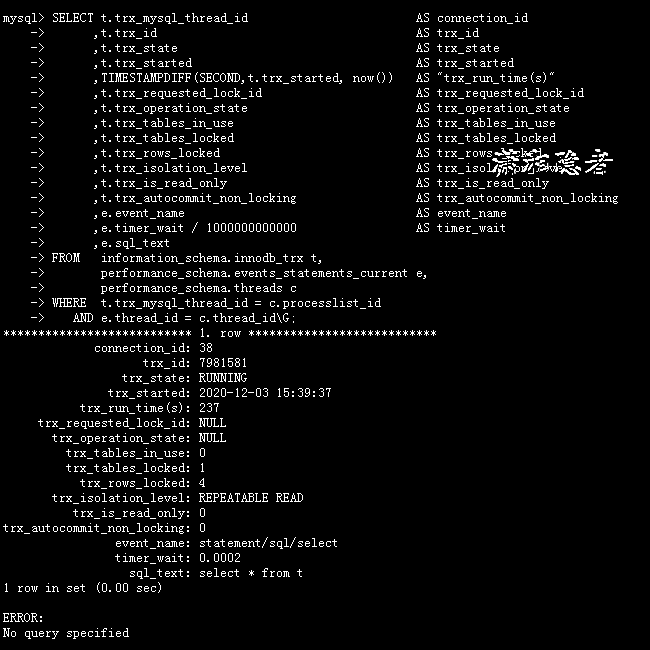
在會話窗口(連接ID=38)繼續執行下面SQL:"select * from t;"。 如下所示
mysql> set session autocommit=0;
Query OK, 0 rows affected (0.01 sec)

mysql> delete from kkk where id =1;
Query OK, 1 row affected (0.00 sec)

mysql> select * from t;
+------+
| a |
+------+
| test |
+------+
1 row in set (0.00 sec)

mysql>
在會話窗口(連接ID=39)上繼續執行下面SQL,你會發現捕獲的是事務最后執行的SQL語句“select * from t”
mysql> SELECT t.trx_mysql_thread_id   AS connection_id
 -> ,t.trx_id     AS trx_id
 -> ,t.trx_state     AS trx_state
 -> ,t.trx_started    AS trx_started
 -> ,TIMESTAMPDIFF(SECOND,t.trx_started, now()) AS "trx_run_time(s)"
 -> ,t.trx_requested_lock_id   AS trx_requested_lock_id
 -> ,t.trx_operation_state   AS trx_operation_state
 -> ,t.trx_tables_in_use    AS trx_tables_in_use
 -> ,t.trx_tables_locked    AS trx_tables_locked
 -> ,t.trx_rows_locked    AS trx_rows_locked
 -> ,t.trx_isolation_level   AS trx_isolation_level
 -> ,t.trx_is_read_only    AS trx_is_read_only
 -> ,t.trx_autocommit_non_locking   AS trx_autocommit_non_locking
 -> ,e.event_name     AS event_name
 -> ,e.timer_wait / 1000000000000   AS timer_wait
 -> ,e.sql_text
 -> FROM information_schema.innodb_trx t,
 -> performance_schema.events_statements_current e,
 -> performance_schema.threads c
 -> WHERE t.trx_mysql_thread_id = c.processlist_id
 -> AND e.thread_id = c.thread_id\G;
*************************** 1. row ***************************
  connection_id: 38
   trx_id: 7981581
   trx_state: RUNNING
  trx_started: 2020-12-03 15:39:37
  trx_run_time(s): 237
 trx_requested_lock_id: NULL
 trx_operation_state: NULL
  trx_tables_in_use: 0
  trx_tables_locked: 1
  trx_rows_locked: 4
 trx_isolation_level: REPEATABLE READ
  trx_is_read_only: 0
trx_autocommit_non_locking: 0
  event_name: statement/sql/select
  timer_wait: 0.0002
   sql_text: select * from t
1 row in set (0.00 sec)

ERROR:
No query specified
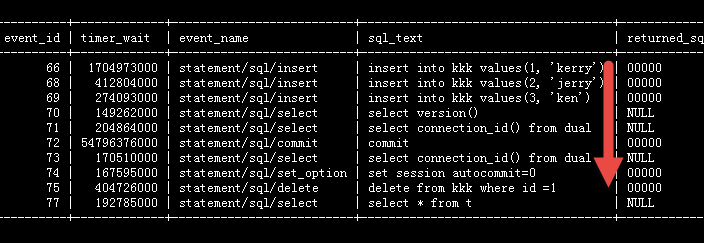
也是說上面SQL只能獲取未提交事務最后執行的一個SQL語句,生產環境中,一個事務中往往不止一個SQL語句,而是多個SQL語句的集合。如果想將一個未提交事務里面所有執行過的SQL找出來怎么辦呢?其實在MySQL中還是有辦法的。下面SQL語句就可以找出或者
SELECT trx.trx_mysql_thread_id AS processlist_id
 ,sc.thread_id
 ,trx.trx_started
 ,TO_SECONDS(now())-TO_SECONDS(trx_started) AS trx_last_time
 ,pc1.user
 ,pc1.host
 ,pc1.db
 ,sc.SQL_TEXT AS current_sql_text
 ,sh.history_sql_test
FROM INFORMATION_SCHEMA.INNODB_TRX trx
INNER JOIN INFORMATION_SCHEMA.processlist pc1 ON trx.trx_mysql_thread_id=pc1.id
INNER JOIN performance_schema.threads th on th.processlist_id = trx.trx_mysql_thread_id
INNER JOIN performance_schema.events_statements_current sc ON sc.THREAD_ID = th.THREAD_ID
INNER JOIN (
  SELECT thread_id AS thread_id, GROUP_CONCAT(SQL_TEXT SEPARATOR ';') AS history_sql_test
  FROM performance_schema.events_statements_history
  GROUP BY thread_id
  ) sh ON sh.thread_id = th.thread_id
WHERE trx_mysql_thread_id != connection_id()
 AND TO_SECONDS(now())-TO_SECONDS(trx_started) >= 0 ;
但是這兩個SQL有個問題:它會找出當前連接歷史上所有執行過的SQL(當然前提是這些SQL還保存在performance_schema.events_statements_history表中),也就是說這個SQL,不僅查詢出未提交事務所有執行過的腳本,而且會查詢出很多歷史SQL腳本,例如,這個會話(連接)之前事務的SQL語句,而且還有一個比較頭疼的問題:這里不好區分哪些SQL對應哪些事務。需要借助其他信息來甄別。比較費時費力。如下截圖所示。
因為只有information_schema.innodb_trx系統表中包含事務的開始時間(trx_started),其它系統表沒有跟事務相關的時間,只能借助performance_schema.events_statements_history中的TIMER_START字段來獲取事件的SQL開始執行的時間,而這個時間必然是小于或等于對應事務的開始時間(trx_started)的。所以從這個突破口來找出未提交事務的所有SQL,下面是關于TIMER_START等字段的詳細介紹。
關于TIMER_START,TIMER_END,TIMER_WAIT的介紹如下:
TIMER_START,TIMER_END,TIMER_WAIT:事件的時間信息。這些值的單位是皮秒(萬億分之一秒)。
TIMER_START和TIMER_END值表示事件的開始時間和結束時間。
TIMER_WAIT是事件執行消耗的時間(持續時間)
如果事件未執行完成,則TIMER_END為當前時間,TIMER_WAIT為當前為止所經過的時間(TIMER_END - TIMER_START)。
如果監視儀器配置表setup_instruments中對應的監視器TIMED字段被設置為 NO,則不會收集該監視器的時間信息,那么對于該事件采集的信息記錄中,TIMER_START,TIMER_END和TIMER_WAIT字段值均為NULL
測試、折騰了好久,終于搞出了一個幾乎完美的SQL:
SELECT @dt_ts:=UNIX_TIMESTAMP(NOW());
SELECT
 @dt_timer:=MAX(sh.TIMER_START)
FROM performance_schema.threads AS t
INNER JOIN performance_schema.events_statements_history AS sh
ON t.`THREAD_ID`=sh.`THREAD_ID`
WHERE t.PROCESSLIST_ID=CONNECTION_ID();


SELECT sh.current_schema  AS database_name
 ,t.thread_id
 ,it.trx_mysql_thread_id  AS connection_id
 ,it.trx_id
 ,sh.event_id
 ,it.trx_state
 ,REPLACE(REPLACE(REPLACE(sh.`SQL_TEXT`,'\n',' '),'\r',' '),'\t',' ') AS executed_sql
 ,it.trx_started
 ,FROM_UNIXTIME(@dt_ts-CAST((@dt_timer-sh.TIMER_START)/1000000000000 AS SIGNED)) AS start_time
 ,FROM_UNIXTIME(@dt_ts-CAST((@dt_timer-sh.TIMER_END) /1000000000000 AS SIGNED)) AS end_time
 ,(sh.TIMER_END-sh.TIMER_START)/1000000000000 AS used_seconds
 ,sh.TIMER_WAIT/1000000000000 AS wait_seconds
 ,sh.LOCK_TIME/1000000000000 AS lock_seconds
 ,sh.ROWS_AFFECTED AS affected_rows
 ,sh.ROWS_SENT AS send_rows
FROM performance_schema.threads AS t
INNER JOIN information_schema.innodb_trx it ON it.trx_mysql_thread_id = t.processlist_id
INNER JOIN performance_schema.events_statements_history AS sh
 ON t.`THREAD_ID`=sh.`THREAD_ID`
WHERE t.PROCESSLIST_ID IN (
  SELECT
   p.ID AS conn_id
  FROM `information_schema`.`INNODB_TRX` t
  INNER JOIN `information_schema`.`PROCESSLIST` p
   ON t.trx_mysql_thread_id=p.id
  WHERE t.trx_state='RUNNING'
   AND p.COMMAND='Sleep'
   AND p.TIME>2
  )
AND sh.TIMER_START@dt_timer
AND FROM_UNIXTIME(@dt_ts-CAST((@dt_timer-sh.TIMER_START)/1000000000000 AS SIGNED)) >=it.trx_started
ORDER BY it.trx_id ASC, sh.TIMER_START ASC;
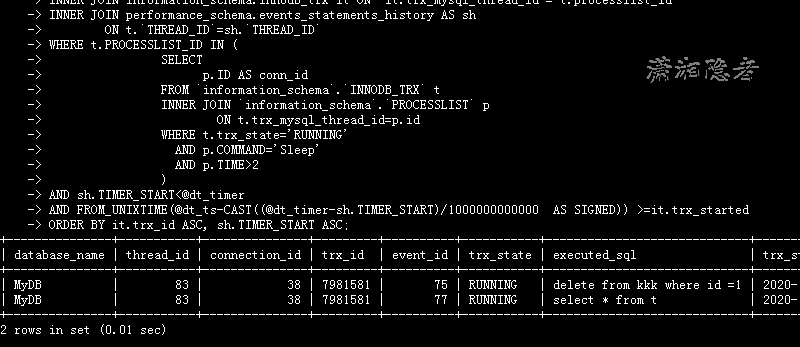
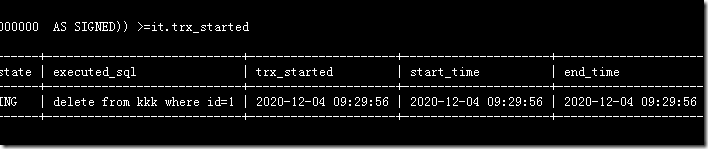
它能找出未提交事務的SQL,簡單測試完全沒有問題,同時構造幾個未提交事務測試也OK。但是上面SQL由三個SQL組成,總感覺有點別扭,研究了一下,可以改造成下面SQL。
SELECT sh.current_schema AS database_name
,t.thread_id
,it.trx_mysql_thread_id AS connection_id
,it.trx_id
,sh.event_id
,it.trx_state
,REPLACE(REPLACE(REPLACE(sh.`SQL_TEXT`,'\n',' '),'\r',' '),'\t',' ') AS executed_sql
,it.trx_started
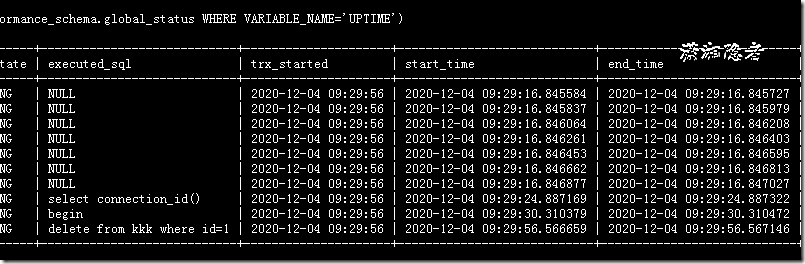
,DATE_SUB(NOW(), INTERVAL (SELECT VARIABLE_VALUE FROM performance_schema.global_status WHERE VARIABLE_NAME='UPTIME') - sh.TIMER_START*10e-13 second) AS start_time
,DATE_SUB(NOW(), INTERVAL (SELECT VARIABLE_VALUE FROM performance_schema.global_status WHERE VARIABLE_NAME='UPTIME') - sh.TIMER_END*10e-13 second) AS end_time
,(sh.TIMER_END-sh.TIMER_START)/1000000000000 AS used_seconds
,sh.TIMER_WAIT/1000000000000 AS wait_seconds
,sh.LOCK_TIME/1000000000000 AS lock_seconds
,sh.ROWS_AFFECTED AS affected_rows
,sh.ROWS_SENT AS send_rows
FROM performance_schema.threads AS t
INNER JOIN information_schema.innodb_trx it ON it.trx_mysql_thread_id = t.processlist_id
INNER JOIN performance_schema.events_statements_history AS sh
ON t.`THREAD_ID`=sh.`THREAD_ID`
WHERE t.PROCESSLIST_ID IN (
SELECT
p.ID AS conn_id
FROM `information_schema`.`INNODB_TRX` t
INNER JOIN `information_schema`.`PROCESSLIST` p
ON t.trx_mysql_thread_id=p.id
WHERE t.trx_state='RUNNING'
AND p.COMMAND='Sleep'
AND p.TIME>2
)
AND sh.TIMER_START(SELECT VARIABLE_VALUE*1000000000000 FROM performance_schema.global_status WHERE VARIABLE_NAME='UPTIME')
AND DATE_SUB(NOW(), INTERVAL (SELECT VARIABLE_VALUE FROM performance_schema.global_status WHERE VARIABLE_NAME='UPTIME') - sh.TIMER_START*10e-13 second) >=it.trx_started
ORDER BY it.trx_id ASC, sh.TIMER_START ASC;
注意:performance_schema.global_status是MySQL 5.7引入的,如果數據庫是MySQL 5.6的話,可以用INFORMATION_SCHEMA.GLOBAL_STATUS替換SQL中的performance_schema.global_status
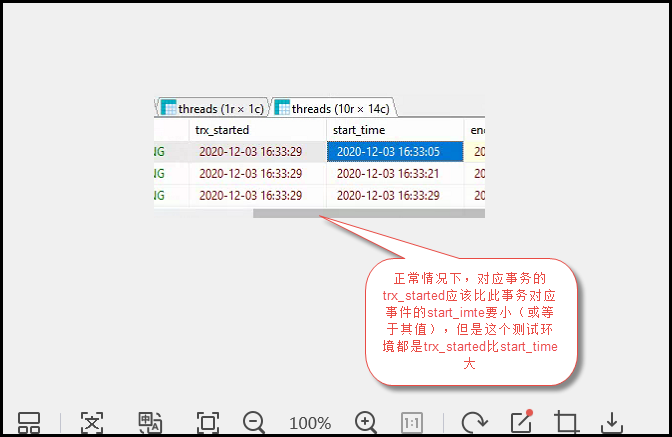
那么是否這個SQL就一定完美了呢? 網友MSSQL123反饋在一個測試環境中,發現上面這種SQL居然查不出任何數據,因為FROM_UNIXTIME(@dt_ts-CAST((@dt_timer-sh.TIMER_START)/1000000000000 AS SIGNED)) >=it.trx_started會將數據過濾掉,檢查發現對應的trx_started值都大于start_time
-------------------------------------------------------------------------補充資料--------------------------------------------------------------------------------------------------------
那么同一個測試環境,隔天測試的時候,突然發現上面第一個SQL正常,第二個SQL就由于不同的寫法,start_time有細微的差別,導致查詢結果完全不同(第二個SQL語句精確到毫秒,對比的時候由于偏差過濾掉一批數據)
------------------------------------------------------------------------------------------------------------------------------------------------
搜索相關文檔,了解到TIMER_START字段值可能有波動或偏差,那么這個波動或偏差可能影響查詢結果,下面內容來自http://porthos.ist.utl.pt/docs/mySQL/performance-schema.html
Modifications to the setup_timers table affect monitoring immediately. Events already in progress may use the original timer for the begin time and the new timer for the end time. To avoid unpredictable results after you make timer changes, use TRUNCATE TABLE to reset Performance Schema statistics.
The timer baseline (“time zero”) occurs at Performance Schema initialization during server startup. TIMER_START and TIMER_END values in events represent picoseconds since the baseline. TIMER_WAIT values are durations in picoseconds.
Picosecond values in events are approximate. Their accuracy is subject to the usual forms of error associated with conversion from one unit to another. If the CYCLE timer is used and the processor rate varies, there might be drift. For these reasons, it is not reasonable to look at the TIMER_START value for an event as an accurate measure of time elapsed since server startup. On the other hand, it is reasonable to use TIMER_START or TIMER_WAIT values in ORDER BY clauses to order events by start time or duration.
The choice of picoseconds in events rather than a value such as microseconds has a performance basis. One implementation goal was to show results in a uniform time unit, regardless of the timer. In an ideal world this time unit would look like a wall-clock unit and be reasonably precise; in other words, microseconds. But to convert cycles or nanoseconds to microseconds, it would be necessary to perform a division for every instrumentation. Division is expensive on many platforms. Multiplication is not expensive, so that is what is used. Therefore, the time unit is an integer multiple of the highest possible TIMER_FREQUENCY value, using a multiplier large enough to ensure that there is no major precision loss. The result is that the time unit is “picoseconds.” This precision is spurious, but the decision enables overhead to be minimized.
Before MySQL 5.7.8, while a wait, stage, statement, or transaction event is executing, the respective current-event tables display the event with TIMER_START populated, but with TIMER_END and TIMER_WAIT set to NULL
其中一段內容翻譯如下:
事件中的皮秒值是近似值。它們的準確性受與從一個單位轉換到另一單位相關的常見誤差形式的影響。如果使用了CYCLE定時器,并且處理器速率有所變化,則可能會有偏差。由于這些原因,將事件的TIMER_START值視為自服務器啟動以來經過的時間的準確度量是不合理的。另一方面,在ORDER BY子句中使用TIMER_START或TIMER_WAIT值來按開始時間或持續時間對事件進行排序是合理的。
我們往往想一擊必殺的解決問題,但是由于復雜的環境和一些不可控因素,現實往往就是“沒有銀彈”這么殘酷。如果遇到TIMER_START的波動或偏差影響查詢結果時,那么我們必須通過文章前面的SQL找出大量SQL,然后通過其它字段或信息人工甄別哪些才是未提交事務的SQL。
參考資料:
https://stackoverflow.com/questions/25607249/mysql-performance-schema-how-to-get-event-time-from-events-statements-current-ta
http://porthos.ist.utl.pt/docs/mySQL/performance-schema.html
https://dev.mysql.com/doc/refman/5.7/en/performance-schema-timing.html
https://dev.mysql.com/doc/refman/8.0/en/performance-schema-timing.html
到此這篇關于MySQL找出未提交事務SQL的文章就介紹到這了,更多相關MySQL找出未提交事務SQL內容請搜索腳本之家以前的文章或繼續瀏覽下面的相關文章希望大家以后多多支持腳本之家!
您可能感興趣的文章:- MySQL 的啟動選項和系統變量實例詳解
- MySQL 的啟動和連接方式實例分析
- CentOS 7.0如何啟動多個MySQL實例教程(mysql-5.7.21)
- MYSQL慢查詢和日志實例講解
- MySQL將select結果執行update的實例教程
- mysql從一張表查詢批量數據并插入到另一表中的完整實例
- springboot配置mysql連接的實例代碼
- MySQL如何優雅的刪除大表實例詳解
- MySQL觸發器的使用場景及方法實例
- MySQL 實例無法啟動的問題分析及解決