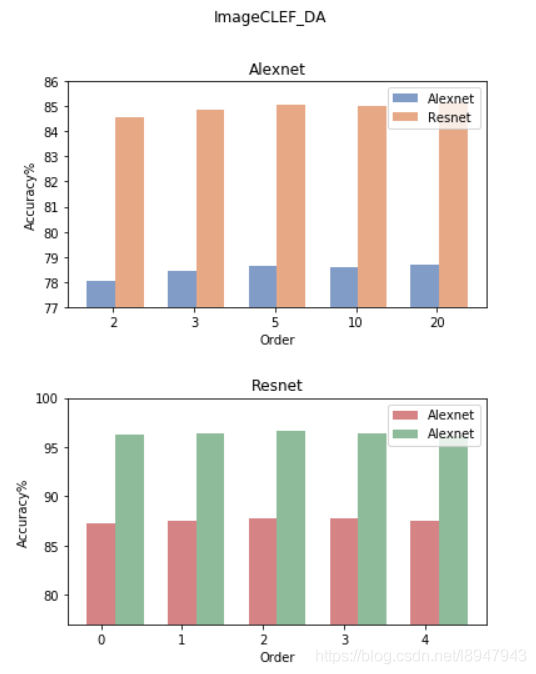
1、涉及到圖的對比會用到子圖形式展示
先看看效果

2、繪制代碼如下
accuracy_alexnet_clef = [78.05, 78.43, 78.65, 78.61, 78.69]
accuracy_resnet_clef  = [84.56, 84.84, 85.07, 85.01, 85.13]
accuracy_alexnet_office10 = [87.30, 87.57, 87.78, 87.72, 87.50]
accuracy_resnet_office10  = [96.31, 96.35, 96.62, 96.43, 96.15]
orders = ['2', '3', '5', '10', '20']
names = ['alexnet', 'resnet']
# 創建兩幅子圖
f, ax = plt.subplots(2,1,figsize=(6, 8))
# 第一根柱子偏移坐標
x = [i for i in range(len(orders))]
# 第二根柱子偏移坐標
x1 = [i + 0.35 for i in range(len(orders))]
# 兩幅子圖之間的間距
plt.subplots_adjust(wspace =0, hspace =0.4)
# 選擇第一幅圖
figure_1 = ax[0]
# 設置x軸偏移和標簽
figure_1.set_xticks([i+0.15 for i in x])
figure_1.set_xticklabels(orders)
# 設置y軸的范圍
figure_1.set_ylim(bottom=77,top=86)
# 繪制柱狀圖,x表示x軸內容,accuracy_alexnet_clef表示y軸的內容,alpha表示透明度,width表示柱子寬度
# label表示圖列
figure_1.bar(x, accuracy_alexnet_clef, alpha=0.7, width = 0.35, facecolor = '#4c72b0', label='Alexnet')
figure_1.bar(x1, accuracy_resnet_clef, alpha=0.7, width = 0.35, facecolor = '#dd8452', label='Resnet')
figure_1.set_ylabel('Accuracy%') # 設置y軸的標簽
figure_1.set_xlabel('Order') # 設置x軸的名稱
figure_1.set_title('Alexnet') # 設置圖一標題名稱
figure_1.legend() # 顯示圖一的圖例
# 選擇第二幅圖
figure_2 = ax[1]
figure_1.set_xticks([i+0.15 for i in x])
figure_1.set_xticklabels(orders)
figure_2.set_ylim(bottom=77,top=100)
figure_2.bar(x, accuracy_alexnet_office10,alpha=0.7,width = 0.35,facecolor = '#c44e52', label='Alexnet')
figure_2.bar(x1, accuracy_resnet_office10,alpha=0.7,width = 0.35,facecolor = '#5f9e6e', label='Alexnet')
# figure_2.bar(orders, accuracy_resnet_clef,alpha=0.7,width = 0.35,facecolor = '#dd8452')
figure_2.set_ylabel('Accuracy%')
figure_2.set_xlabel('Order')
figure_2.set_title('Resnet')
figure_2.legend()
f.suptitle('ImageCLEF_DA') # 設置總標題
plt.show()
補充:python使用matplotlib在一個圖形中繪制多個子圖以及一個子圖中繪制多條動態折線問題
在講解繪制多個子圖之前先簡單了解一下使用matplotlib繪制一個圖,導入繪圖所需庫matplotlib并創建一個等間隔的列表x,將[0,2*pi]等分為50等份,繪制函數sin(x)。當沒有給定x軸數值時,默認以下標作為x的值,如果x值確定,則繪圖時寫為plt.plot(x,y) 。
如若想要繪制一個圖時寫入標簽,則寫為plt.plot(x,y,label="figure1")。
from numpy import *
import matplotlib.pyplot as plt
x = linspace(0, 2 * pi, 50)
plt.plot(sin(x))
plt.xlabel('x-label')
plt.ylabel('y-label', fontsize='large')
plt.title('title')

以下先將整體代碼插入,再分布講解:
import numpy as np
import matplotlib.pyplot as plt
from matplotlib.ticker import MultipleLocator, FormatStrFormatter
def minmax_value(list1):
    minvalue=min(list1)
    maxvalue=max(list1)
    return minvalue,maxvalue
plt.figure(figsize=(16,14),dpi=98)
xmajorLocator = MultipleLocator(1) #將x主刻度標簽設置為1的倍數
plt.rcParams['font.sans-serif']=['SimHei']
plt.rcParams['axes.unicode_minus'] = False
p1 = plt.subplot(121)
p2 = plt.subplot(122)
#圖中展示點的數量
pointcount=5
x=[i for i in range(20)]
print(x)
y1=[i**2 for i in range(20)]
y2=[i*4 for i in range(20)]
y3=[i*3+2 for i in range(20)]
y4=[i*4 for i in range(20)]
for i in range(len(x)-1):
    if ipointcount:
        minx,maxx=minmax_value(x[:pointcount])
        minx,maxx=minmax_value(x[:pointcount])
        minyA,maxyA=minmax_value(y1[:pointcount])
        minyB,maxyB=minmax_value(y2[:pointcount])

        maxy1=max(maxyA,maxyB)
        miny1=min(minyA,minyB)
        p1.axis([minx,maxx,miny1,maxy1])
        p1.grid(True)
        A,=p1.plot(x[:pointcount],y1[:pointcount],"g-")
        B,=p1.plot(x[:pointcount],y2[:pointcount],"b-")
        #設置主刻度標簽的位置,標簽文本的格式
        p1.xaxis.set_major_locator(xmajorLocator)
        legend=p1.legend(handles=[A,B],labels=["圖1","圖2"])


        minx,maxx=minmax_value(x[:pointcount])
        minx,maxx=minmax_value(x[:pointcount])
        minyA,maxyA=minmax_value(y3[:pointcount])
        minyB,maxyB=minmax_value(y4[:pointcount])

        maxy1=max(maxyA,maxyB)
        miny1=min(minyA,minyB)
        p2.axis([minx,maxx,miny1,maxy1])
        p2.grid(True)
        A,=p2.plot(x[:pointcount],y3[:pointcount],"r-")
        B,=p2.plot(x[:pointcount],y4[:pointcount],"y-")
        #設置主刻度標簽的位置,標簽文本的格式
        p2.xaxis.set_major_locator(xmajorLocator)
        legend=p2.legend(handles=[A,B],labels=["圖3","圖4"])
    elif i>=pointcount:
        minx,maxx=minmax_value(x[i-pointcount:i])
        minx,maxx=minmax_value(x[i-pointcount:i])
        minyA,maxyA=minmax_value(y1[i-pointcount:i])
        minyB,maxyB=minmax_value(y2[i-pointcount:i])

        maxy1=max(maxyA,maxyB)
        miny1=min(minyA,minyB)
        p1.axis([minx,maxx,miny1,maxy1])
        p1.grid(True)
        A,=p1.plot(x[i-pointcount:i],y1[i-pointcount:i],"g-")
        B,=p1.plot(x[i-pointcount:i],y2[i-pointcount:i],"b-")
        #設置主刻度標簽的位置,標簽文本的格式
        p1.xaxis.set_major_locator(xmajorLocator)
        legend=p1.legend(handles=[A,B],labels=["圖1","圖2"])
        minx,maxx=minmax_value(x[i-pointcount:i])
        minx,maxx=minmax_value(x[i-pointcount:i])
        minyA,maxyA=minmax_value(y3[i-pointcount:i])
        minyB,maxyB=minmax_value(y4[i-pointcount:i])

        maxy1=max(maxyA,maxyB)
        miny1=min(minyA,minyB)
        p2.axis([minx,maxx,miny1,maxy1])
        p2.grid(True)
        A,=p2.plot(x[i-pointcount:i],y3[i-pointcount:i],"r-")
        B,=p2.plot(x[i-pointcount:i],y4[i-pointcount:i],"y-")
        #設置主刻度標簽的位置,標簽文本的格式
        p2.xaxis.set_major_locator(xmajorLocator)
        legend=p2.legend(handles=[A,B],labels=["圖3","圖4"])
    p1.set_xlabel("橫軸屬性名一",fontsize=14)
    p1.set_ylabel("縱軸屬性名一",fontsize=14)
    p1.set_title("主題一",fontsize=18)

    p2.set_xlabel("橫軸屬性名二",fontsize=14)
    p2.set_ylabel("縱軸屬性名二",fontsize=14)
    p2.set_title("主題二",fontsize=18)
    plt.pause(0.3)
    plt.tight_layout(pad=4, w_pad=4.0, h_pad=3.0)
運行結果為:

1、導入庫
import numpy as np
import matplotlib.pyplot as plt
from matplotlib.ticker import MultipleLocator, FormatStrFormatter
2、由于繪圖過程中多次使用獲取最大最小值,將獲取最大最小值寫入函數,后面直接調用函數即可。
def minmax_value(list1):
    minvalue=min(list1)
    maxvalue=max(list1)
    return minvalue,maxvalue
3、
(1)創建自定義圖像,并設置figured的長和寬以及dpi參數指定繪圖對象的分辨率;
(2)設置x軸刻度的間隔;
(3)對本次繪圖中的字體進行設置;
(4)在matplotlib下,一個figure對象可以包含多個子圖(Axes),使用subplot()快速繪制。
plt.figure(figsize=(16,14),dpi=98)xmajorLocator = MultipleLocator(1)
plt.rcParams['font.sans-serif']=['SimHei']  plt.rcParams['axes.unicode_minus'] = False

p1 = plt.subplot(121)p2 = plt.subplot(122)
4、當數據量過多時,對數據一次性展示不能夠達到對數據內部信息的解讀。本例采用一次展示其中一部分數據,并動態的更新圖片,于此同時,動態更新橫縱坐標軸的取值范圍。下面代碼首先設置了每次展示點的數量,并獲取了主題一中的所有數據值。根據x取值范圍和值域y獲取當前繪圖過程中的橫縱坐標取值范圍,最后根據x,y的值進行繪圖。
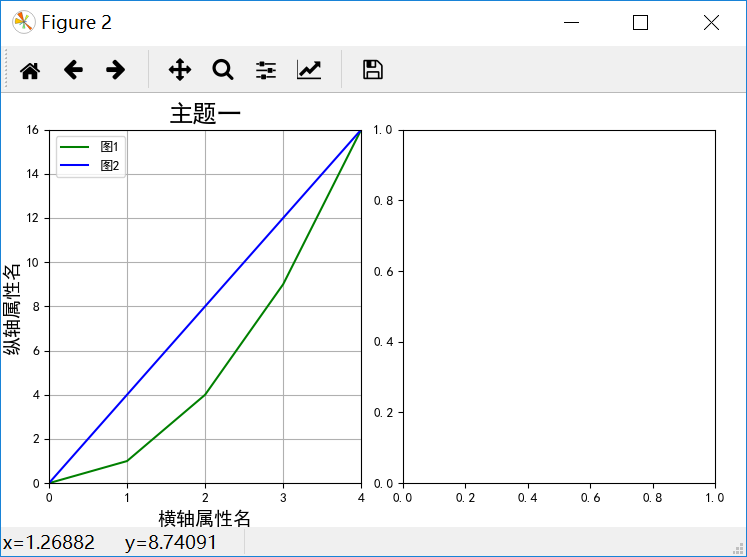
下面將先在一個子圖上顯示兩條靜態折現。當使用動態的折線圖時,只需動態更新數據和橫縱坐標的取值范圍。總體代碼中已經寫出,下面不再贅述。
#圖中展示點的數量
pointcount=5
x=[i for i in range(20)]
y1=[i**2 for i in range(20)]
y2=[i*4 for i in range(20)]
minx,maxx=minmax_value(x[:pointcount])
minyA,maxyA=minmax_value(y1[:pointcount])
minyB,maxyB=minmax_value(y2[:pointcount])

maxy1=max(maxyA,maxyB)
miny1=min(minyA,minyB)
p1.axis([minx,maxx,miny1,maxy1])
p1.grid(True)#繪圖過程中出現的網格設置
A,=p1.plot(x[:pointcount],y1[:pointcount],"g-")
B,=p1.plot(x[:pointcount],y2[:pointcount],"b-")#設置主刻度標簽的位置,標簽文本的格式p1.xaxis.set_major_locator(xmajorLocator)legend=p1.legend(handles=[A,B],labels=["圖1","圖2"])
結果如下所示:

5、設置邊界,不設置邊界經常會因為橫縱軸的字體太大等其他原因導致橫縱軸或者標題只能顯示其中一部分。
plt.tight_layout(pad=4, w_pad=4.0, h_pad=3.0)
以上為個人經驗,希望能給大家一個參考,也希望大家多多支持腳本之家。
您可能感興趣的文章:- python使用matplotlib:subplot繪制多個子圖的示例
- Python figure參數及subplot子圖繪制代碼
- python 實現在一張圖中繪制一個小的子圖方法
- python繪制多個子圖的實例