目錄
- 一、導入所需的庫
- 二、定義可視化函數顯示圖像上的邊界框和類標簽
- 三、獲取圖像和標注
- 四、使用RandomSizedBBoxSafeCrop保留原始圖像中的所有邊界框
- 五、定義增強管道
- 六、輸入用于增強的圖像和邊框
- 七、其他不同隨機種子的示例
一、導入所需的庫
import random

import cv2
from matplotlib import pyplot as plt

import albumentations as A
二、定義可視化函數顯示圖像上的邊界框和類標簽
可視化函數參考https://github.com/facebookresearch/Detectron/blob/master/detectron/utils/vis.py
BOX_COLOR = (255, 0, 0) # Red
TEXT_COLOR = (255, 255, 255) # White


def visualize_bbox(img, bbox, class_name, color=BOX_COLOR, thickness=2):
    """Visualizes a single bounding box on the image"""
    x_min, y_min, w, h = bbox
    x_min, x_max, y_min, y_max = int(x_min), int(x_min + w), int(y_min), int(y_min + h)

    cv2.rectangle(img, (x_min, y_min), (x_max, y_max), color=color, thickness=thickness)

    ((text_width, text_height), _) = cv2.getTextSize(class_name, cv2.FONT_HERSHEY_SIMPLEX, 0.35, 1)
    cv2.rectangle(img, (x_min, y_min - int(1.3 * text_height)), (x_min + text_width, y_min), BOX_COLOR, -1)
    cv2.putText(
        img,
        text=class_name,
        org=(x_min, y_min - int(0.3 * text_height)),
        fontFace=cv2.FONT_HERSHEY_SIMPLEX,
        fontScale=0.35,
        color=TEXT_COLOR,
        lineType=cv2.LINE_AA,
    )
    return img


def visualize(image, bboxes, category_ids, category_id_to_name):
    img = image.copy()
    for bbox, category_id in zip(bboxes, category_ids):
        class_name = category_id_to_name[category_id]
        img = visualize_bbox(img, bbox, class_name)
    plt.figure(figsize=(12, 12))
    plt.axis('off')
    plt.imshow(img)
三、獲取圖像和標注
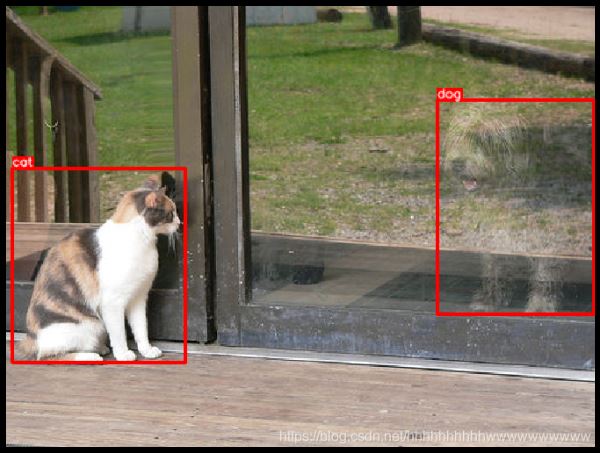
在此示例中,我們將使用來自COCO數據集的圖像,該圖像具有兩個關聯的邊界框。 該映像位于http://cocodataset.org/#explore?id=386298
從磁盤加載圖像
image = cv2.imread('images/000000386298.jpg')
image = cv2.cvtColor(image, cv2.COLOR_BGR2RGB)
用坐標和類標簽定義兩個邊界框
這些邊界框的坐標使用coco格式聲明。 每個邊界框使用四個值[x_min, y_min, width, height]進行描述。 有關邊界框坐標的不同格式的詳細說明,請參閱有關邊界框的文檔文章-https://albumentations.ai/docs/getting_started/bounding_boxes_augmentation/。
bboxes = [[5.66, 138.95, 147.09, 164.88], [366.7, 80.84, 132.8, 181.84]]
category_ids = [17, 18]

# We will use the mapping from category_id to the class name
# to visualize the class label for the bounding box on the image
category_id_to_name = {17: 'cat', 18: 'dog'}
展示圖像的邊框
visualize(image, bboxes, category_ids, category_id_to_name)
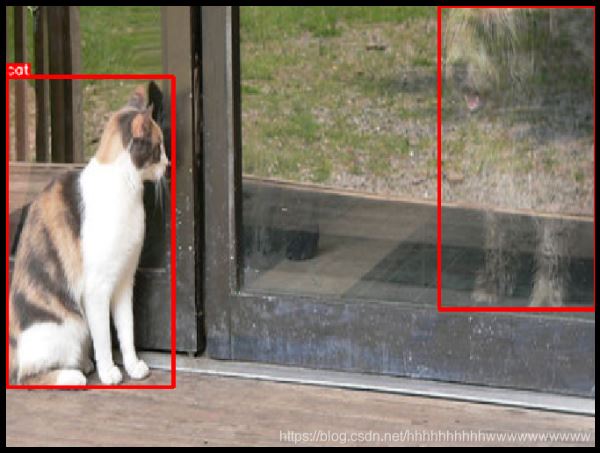
四、使用RandomSizedBBoxSafeCrop保留原始圖像中的所有邊界框
RandomSizedBBoxSafeCrop crops a random part of the image. It ensures that the cropped part will contain all bounding boxes from the original image. Then the transform rescales the crop to height and width specified by the respective parameters. The erosion_rate parameter controls how much area of the original bounding box could be lost after cropping. erosion_rate = 0.2 means that the augmented bounding box's area could be up to 20% smaller than the area of the original bounding box.
RandomSizedBBoxSafeCrop裁剪圖像的隨機部分。 它確保裁剪的部分將包含原始圖像的所有邊界框。 然后,變換會將作物重新縮放為相應參數指定的高度和寬度。 erosion_rate參數控制裁剪后可能丟失原始邊界框的面積。 frosting_rate = 0.2表示擴充后的邊界框的面積可能比原始邊界框的面積小20%。
五、定義增強管道
transform = A.Compose(
    [A.RandomSizedBBoxSafeCrop(width=448, height=336, erosion_rate=0.2)],
    bbox_params=A.BboxParams(format='coco', label_fields=['category_ids']),
)
六、輸入用于增強的圖像和邊框
我們固定隨機種子是為了可視化目的,因此增強將始終產生相同的結果。 在真實的計算機視覺管道中,您不應該在對圖像應用轉換之前固定隨機種子,因為在這種情況下,管道將始終輸出相同的圖像。 圖像增強的目的是每次使用不同的變換。
random.seed(7)
transformed = transform(image=image, bboxes=bboxes, category_ids=category_ids)
visualize(
    transformed['image'],
    transformed['bboxes'],
    transformed['category_ids'],
    category_id_to_name,
)

七、其他不同隨機種子的示例
random.seed(3)
transformed = transform(image=image, bboxes=bboxes, category_ids=category_ids)
visualize(
    transformed['image'],
    transformed['bboxes'],
    transformed['category_ids'],
    category_id_to_name,
)
random.seed(444)
transformed = transform(image=image, bboxes=bboxes, category_ids=category_ids)
visualize(
    transformed['image'],
    transformed['bboxes'],
    transformed['category_ids'],
    category_id_to_name,
)
到此這篇關于Python深度學習之使用Albumentations對目標檢測任務做增強的文章就介紹到這了,更多相關用Albumentations對目標做增強內容請搜索腳本之家以前的文章或繼續瀏覽下面的相關文章希望大家以后多多支持腳本之家!
您可能感興趣的文章:- python使用matplotlib顯示圖像失真的解決方案
- Python深度學習之圖像標簽標注軟件labelme詳解
- Python深度學習albumentations數據增強庫