1:吞吐率(Requests per second)
服務器并發處理能力的量化描述,單位是reqs/s,指的是某個并發用戶數下單位時間內處理的請求數。某個并發用戶數下單位時間內能處理的最大請求數,稱之為最大吞吐率。
記住:吞吐率是基于并發用戶數的。這句話代表了兩個含義,1:吞吐率和并發用戶數相關;2:不同的并發用戶數下,吞吐率一般是不同的。
計算公式:總請求數 / 處理完成這些請求數所花費的時間,即
Request per second = Complete requests / Time taken for tests
2:并發連接數(The number of concurrent connections)
并發連接數指的是某個時刻服務器所接受的請求數目,簡單的講,就是一個會話。
3:并發用戶數(The number of concurrent users,Concurrency Level)
要注意區分這個概念和并發連接數之間的區別,一個用戶可能同時會產生多個會話,也即連接數。在HTTP/1.1下,IE7支持兩個并發連接,IE8支持6個并發連接,FireFox3支持4個并發連接,所以相應的,我們的并發用戶數就得除以這個基數。
4:用戶平均請求等待時間(Time per request)
計算公式:處理完成所有請求數所花費的時間/ (總請求數 / 并發用戶數),即
Time per request = Time taken for tests /( Complete requests / Concurrency Level)
5:服務器平均請求等待時間(Time per request: across all concurrent requests)
計算公式:處理完成所有請求數所花費的時間 / 總請求數,即
Time taken for / testsComplete requests
可以看到,它是吞吐率的倒數。
同時,它也=用戶平均請求等待時間/并發用戶數,即
Time per request / Concurrency Level
官網下載地址:https://www.apachelounge.com/download/
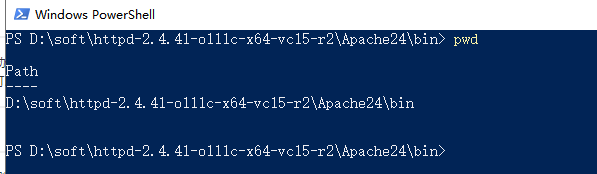
下載后解壓,用cmd進入當前的項目解壓目錄:
然后進入shell命令的執行界面(進入到bin目錄下):
測試命令:
./ab -n 100 -c 10 http://localhost:8085/linewell/test1/pass/testApacheBench.do
-n標識請求的個數,-c表示一次最多幾次請求同時發出。
因為本人java測試,如果-c設置為1,java后端controller延時一秒, 是會一個一個處理的,基本需要100次處理。如果-c為10,是會一次性處理10個。
輸出:
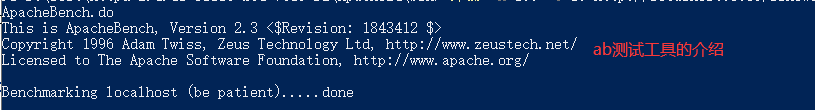
This is ApacheBench, Version 2.3 <$Revision: 1843412 $>
Copyright 1996 Adam Twiss, Zeus Technology Ltd, http://www.zeustech.net/
Licensed to The Apache Software Foundation, http://www.apache.org/
Benchmarking localhost (be patient).....done
Server Software:
Server Hostname: localhost
Server Port: 8085
Document Path: /linewell/test1/pass/testApacheBench.do
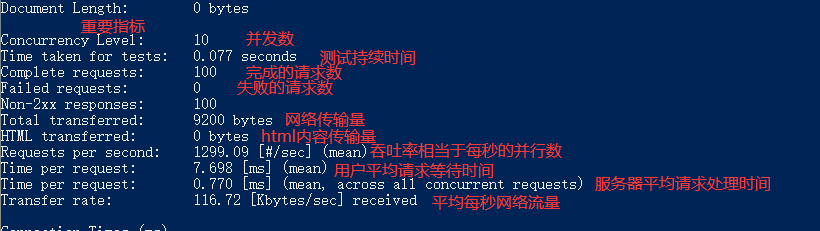
Document Length: 0 bytes
Concurrency Level: 10
Time taken for tests: 0.077 seconds
Complete requests: 100
Failed requests: 0
Non-2xx responses: 100
Total transferred: 9200 bytes
HTML transferred: 0 bytes
Requests per second: 1299.09 [#/sec] (mean)
Time per request: 7.698 [ms] (mean)
Time per request: 0.770 [ms] (mean, across all concurrent requests)
Transfer rate: 116.72 [Kbytes/sec] received
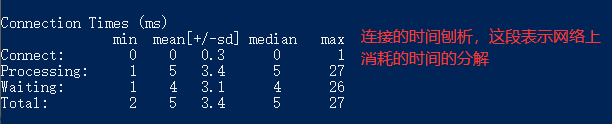
Connection Times (ms)
min mean[+/-sd] median max
Connect: 0 0 0.3 0 1
Processing: 1 5 3.4 5 27
Waiting: 1 4 3.1 4 26
Total: 2 5 3.4 5 27
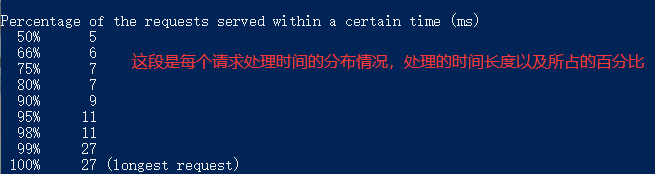
Percentage of the requests served within a certain time (ms)
50% 5
66% 6
75% 7
80% 7
90% 9
95% 11
98% 11
99% 27
100% 27 (longest request)
輸出結果解析:


以上就是本文的全部內容,希望對大家的學習有所幫助,也希望大家多多支持腳本之家。