前言:
大家一般都知道subplot可以畫子圖,但是subplots也可以畫子圖,鑒于subplots介紹比較少,這里做一個對比,兩者沒有功能一致。
對比開始:
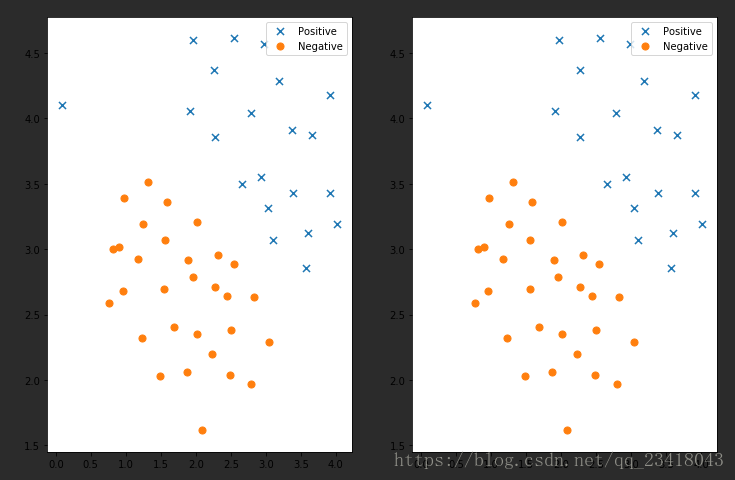
需求:畫出兩張子圖,在一行顯示,子圖中的內容一模一樣
subplot代碼:
ax1 = plt.subplot(1,2,1)
ax1.scatter(positive['X1'], positive['X2'], s=50, marker='x', label='Positive')
ax1.scatter(negative['X1'], negative['X2'], s=50, marker='o', label='Negative')
ax1.legend()#添加圖列就是右上角的點說明
ax2 = plt.subplot(1,2,2)
ax2.scatter(positive['X1'], positive['X2'], s=50, marker='x', label='Positive')
ax2.scatter(negative['X1'], negative['X2'], s=50, marker='o', label='Negative')
ax2.legend()#添加圖列就是右上角的點說明
subplots代碼:
fig, ax = plt.subplots(figsize=(12,8),ncols=2,nrows=1)#該方法會返回畫圖對象和坐標對象ax,figsize是設置子圖長寬(1200,800)
ax[0].scatter(positive['X1'], positive['X2'], s=50, marker='x', label='Positive')
ax[0].scatter(negative['X1'], negative['X2'], s=50, marker='o', label='Negative')
ax[0].legend()#添加圖列就是右上角的點說明
ax[1].scatter(positive['X1'], positive['X2'], s=50, marker='x', label='Positive')
ax[1].scatter(negative['X1'], negative['X2'], s=50, marker='o', label='Negative')
ax[1].legend()#添加圖列就是右上角的點說明

對比結果:
可以看出來兩者都可以實現畫子圖功能,只不過subplots幫我們把畫板規劃好了,返回一個坐標數組對象,而subplot每次只能返回一個坐標對象,subplots可以直接指定畫板的大小。
參考博客:Matplotlib的子圖subplot的使用
參考博客:subplots與figure函數參數解釋說明以及簡單的使用腳本實例
到此這篇關于Matplotlib實現subplot和subplots簡單對比的文章就介紹到這了,更多相關Matplotlib subplot和subplots內容請搜索腳本之家以前的文章或繼續瀏覽下面的相關文章希望大家以后多多支持腳本之家!
您可能感興趣的文章:- matplotlib subplots 設置總圖的標題方法
- matplotlib subplots 調整子圖間矩的實例
- Matplotlib 生成不同大小的subplots實例