shapefile是GIS中非常重要的一種數(shù)據(jù)類型,在ArcGIS中被稱為要素類(Feature Class),主要包括點(diǎn)(point)、線(polyline)和多邊形(polygon)。作為一種十分常見的矢量文件格式,geopandas對(duì)shapefile提供了很好的讀取和寫出支持,其DataFrame結(jié)構(gòu)相當(dāng)于GIS數(shù)據(jù)中的一張屬性表,使得可以直接操作矢量數(shù)據(jù)屬性表,使得在python中操作地理數(shù)據(jù)更方便。本文給大家介紹下用Python腳本中對(duì)Shapefile文件(.shp,.shx,.dbf等格式)進(jìn)行讀寫操作。
開發(fā)準(zhǔn)備
由于geopandas有好幾個(gè)依賴庫(kù),推薦大家使用 Miniconda或是 Anaconda來安裝geopandas。
安裝命令:
conda install -c conda-forge geopandas
國(guó)內(nèi)鏡像:
conda install -c https://mirrors.tuna.tsinghua.edu.cn/anaconda/cloud/conda-forge geopandas
使用導(dǎo)入:import geopandas
我這里用的是geopandas 0.7的版本,版本間差異是不太大,最新0.8版本新增了一些查詢、入庫(kù)方面的特性。
shapefile文件信息的讀取
相比pyshp庫(kù),geopandas庫(kù)的數(shù)據(jù)讀取、展示、分析、拓展的效果要更好。它可以讀取zip中的shapefile,還可以讀取GeoJson、ArcGIS中地理數(shù)據(jù)庫(kù)gdb,以及QGIS中GeoPackage 存放的矢量數(shù)據(jù)。
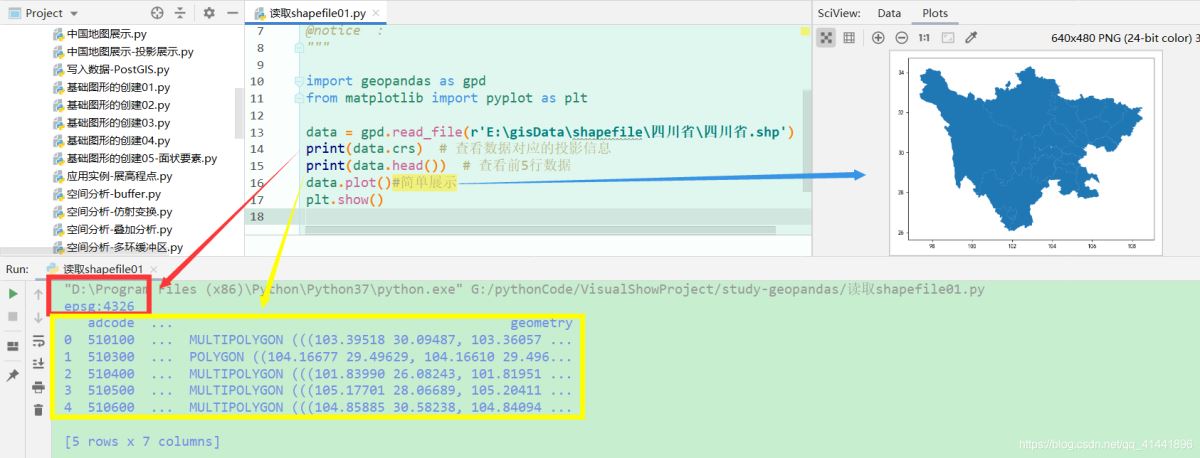
import geopandas as gpd
from matplotlib import pyplot as plt

data = gpd.read_file(r'E:\gisData\行政區(qū)劃數(shù)據(jù)2019\省.shp')#讀取磁盤上的矢量文件
#data = gpd.read_file('shapefile/china.gdb', layer='province')#讀取gdb中的矢量數(shù)據(jù)
print(data.crs)  # 查看數(shù)據(jù)對(duì)應(yīng)的投影信息
print(data.head())  # 查看前5行數(shù)據(jù)
data.plot()
plt.show()#簡(jiǎn)單展示
顯示效果:
shapefile文件的創(chuàng)建
要素類的創(chuàng)建效率很高,既能創(chuàng)建要素實(shí)體,也能寫入屬性信息和定義投影。下面先簡(jiǎn)單介紹下三種要素類的創(chuàng)建方法。
點(diǎn)狀要素類的創(chuàng)建

核心代碼:
# 對(duì)應(yīng)shapely.geometry中的Point,用于表示單個(gè)點(diǎn),下面我們創(chuàng)建一個(gè)由若干Point對(duì)象組成
cq = geopandas.GeoSeries([geometry.Point(110, 60),
                          geometry.Point(110.5, 50.4),
                          geometry.Point(120, 55),
                          geometry.Point(107.8, 54.6),
                          geometry.Point(114.6, 50)],
                         crs='EPSG:4326',  # 指定坐標(biāo)系為WGS 1984
                         index=['一號(hào)', '二號(hào)', '三號(hào)', '四號(hào)', '五號(hào)'],  # 相關(guān)的索引
                         )
# 導(dǎo)出數(shù)據(jù)為shapefile文件
cq.to_file('./output/{}.shp'.format(os.path.basename(__file__).replace('.py', '')),
           driver='ESRI Shapefile',
           encoding='utf-8')
線狀要素類的創(chuàng)建
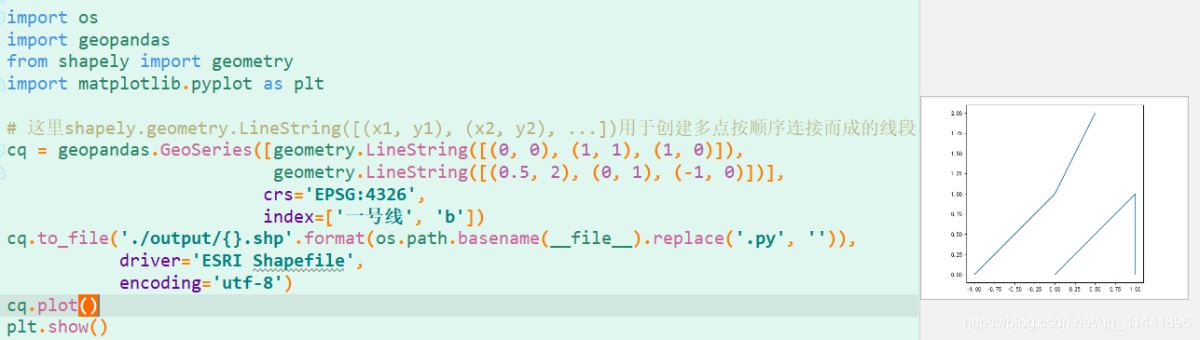
核心代碼:
# 這里shapely.geometry.LineString([(x1, y1), (x2, y2), ...])用于創(chuàng)建多點(diǎn)按順序連接而成的線段
cq = geopandas.GeoSeries([geometry.LineString([(0, 0), (1, 1), (1, 0)]),
                          geometry.LineString([(0.5, 2), (0, 1), (-1, 0)])],
                         crs='EPSG:4326',
                         index=['一號(hào)線', 'b'])
cq.to_file('./output/{}.shp'.format(os.path.basename(__file__).replace('.py', '')),
           driver='ESRI Shapefile',
           encoding='utf-8')
面狀要素類的創(chuàng)建
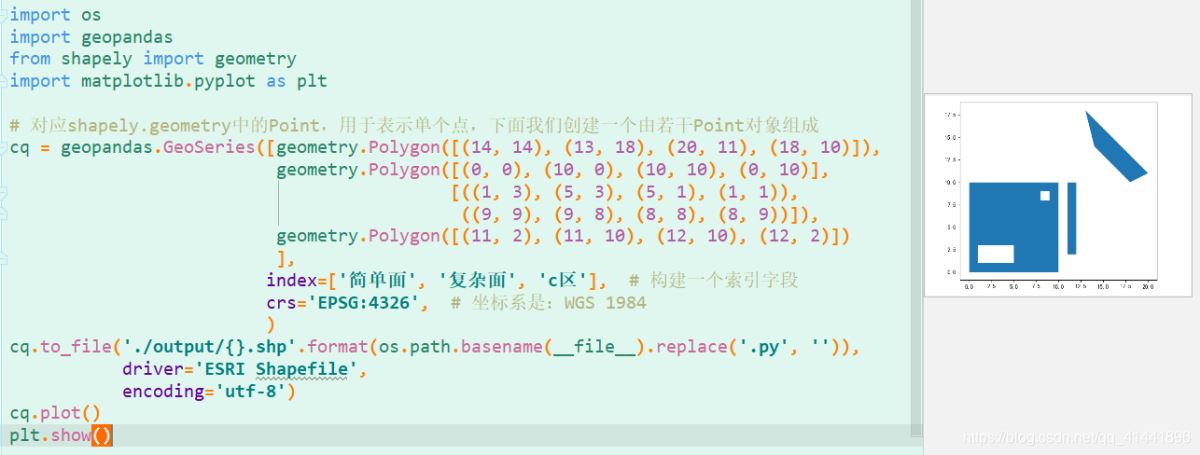
核心代碼:
# 對(duì)應(yīng)shapely.geometry中的Polygon,用于表示面,下面我們創(chuàng)建一個(gè)由若干Polygon對(duì)象組成
cq = geopandas.GeoSeries([geometry.Polygon([(14, 14), (13, 18), (20, 11), (18, 10)]),
                          geometry.Polygon([(0, 0), (10, 0), (10, 10), (0, 10)],
                                           [((1, 3), (5, 3), (5, 1), (1, 1)),
                                            ((9, 9), (9, 8), (8, 8), (8, 9))]),
                          geometry.Polygon([(11, 2), (11, 10), (12, 10), (12, 2)])
                          ],
                         index=['簡(jiǎn)單面', '復(fù)雜面', 'c區(qū)'],  # 構(gòu)建一個(gè)索引字段
                         crs='EPSG:4326',  # 坐標(biāo)系是:WGS 1984
                         )
cq.to_file('./output/{}.shp'.format(os.path.basename(__file__).replace('.py', '')),
           driver='ESRI Shapefile',
           encoding='utf-8')
拓展應(yīng)用實(shí)例
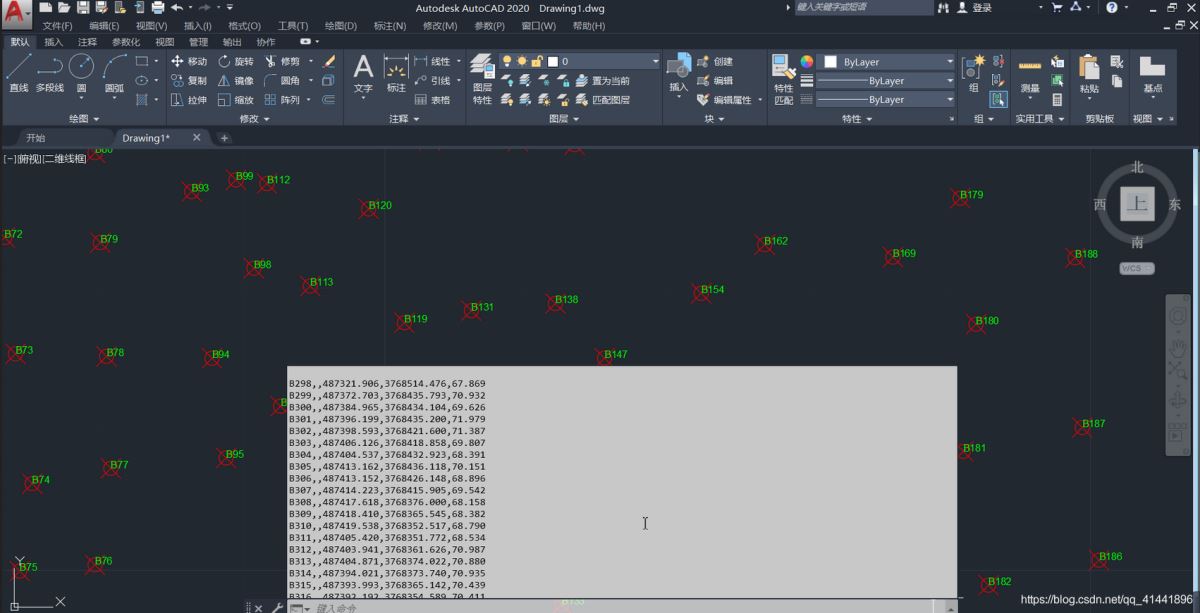
展高程點(diǎn)
高程點(diǎn)文件存儲(chǔ)格式與CASS中讀取的DAT格式一致,示例:【1,ZDH ,450000.000,4100000,20002,DYG,450000.000,4100000,2000 】其中,“1”代表的是“點(diǎn)號(hào)”,“ZDH”代表的是“代碼”,之后的分別是“東坐標(biāo)、北坐標(biāo)、高程值”即“Y、X、H ”或者是“X、Y、H ”
AutoCAD中展點(diǎn)效果
geopandas中展點(diǎn)效果

實(shí)現(xiàn)代碼
# -*- coding: utf-8 -*-

import pandas as pd
import geopandas as gpd
from shapely.geometry import Point
from matplotlib import pyplot as plt
from matplotlib.ticker import FuncFormatter

# 讀取數(shù)據(jù)
file_path = './data-use/高程數(shù)據(jù).csv'
rankings_colname = ['name', 'mark', 'longitude', 'latitude', 'height'];
df = pd.read_csv(file_path, header=None, names=rankings_colname)
# print(df.head(5))#輸出前五行數(shù)據(jù)查看
xy = [Point(xy) for xy in zip(df['longitude'], df['latitude'])]
pts = gpd.GeoSeries(xy)  # 創(chuàng)建點(diǎn)要素?cái)?shù)據(jù)集
#保存為SHP文件
pts.to_file('./output/展高程點(diǎn).shp', driver='ESRI Shapefile', encoding='utf-8')
"""fig是用來設(shè)置圖像大小參數(shù),ax是行列有多少個(gè)點(diǎn)"""
fig, ax = plt.subplots(figsize=(8, 6))  # 返回一個(gè)包含figure和axes對(duì)象的元組
ax = pts.plot(ax=ax,
              facecolor='white',
              edgecolor='black',
              marker='X',
              linewidth=0.5,  # 內(nèi)外符號(hào)比例系數(shù)
              markersize=12,
              label='高程點(diǎn)')
# 地圖標(biāo)注
new_texts = [plt.text(x_ + 1, y_ + 1, text, fontsize=8) for x_, y_, text in
             zip(df['longitude'], df['latitude'], df['name'])]


# 設(shè)置坐標(biāo)軸
def formatnum(x, pos):
    # return '$%.1f$x$10^{4}$' % (x / 10000)#科學(xué)計(jì)數(shù)法顯示
    return int(x)  # 取整顯示


formatter = FuncFormatter(formatnum)
ax.yaxis.set_major_formatter(formatter)

# 美觀起見隱藏頂部與右側(cè)邊框線
ax.spines['right'].set_visible(False)
ax.spines['top'].set_visible(False)
plt.grid(True, alpha=0.4)  # 顯示網(wǎng)格,透明度為50%
ax.legend(title="圖例", loc='lower right', ncol=1, shadow=True) # 添加圖例
plt.title('展高程點(diǎn)', fontdict={'weight': 'normal', 'size': 20}) # 設(shè)置圖名改變圖標(biāo)題字體
# 保存圖片
plt.savefig('images/展高程點(diǎn).png', dpi=300, bbox_inches='tight', pad_inches=0)
plt.show()
點(diǎn)集轉(zhuǎn)面
將一系列點(diǎn)的集合轉(zhuǎn)為面狀要素類,下面以甘肅省的地震帶為例(字段對(duì)應(yīng):名稱,面索引,點(diǎn)索引,經(jīng)度,緯度)。
數(shù)據(jù)預(yù)覽

效果預(yù)覽
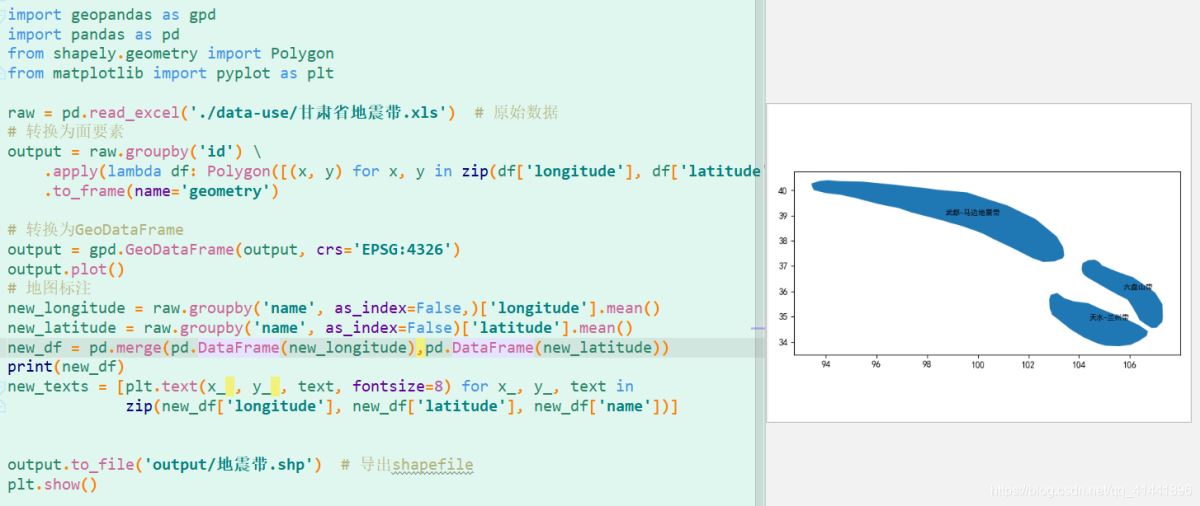

實(shí)現(xiàn)代碼
import geopandas as gpd
import pandas as pd
from shapely.geometry import Polygon
from matplotlib import pyplot as plt

raw = pd.read_excel('./data-use/甘肅省地震帶.xls')  # 原始數(shù)據(jù)
# 轉(zhuǎn)換為面要素
output = raw.groupby('id') \

    .apply(lambda df: Polygon([(x, y) for x, y in zip(df['longitude'], df['latitude'])])) \

    .to_frame(name='geometry')

# 轉(zhuǎn)換為GeoDataFrame
output = gpd.GeoDataFrame(output, crs='EPSG:4326')
output.plot()
# 地圖標(biāo)注
new_longitude = raw.groupby('name', as_index=False,)['longitude'].mean()
new_latitude = raw.groupby('name', as_index=False)['latitude'].mean()
new_df = pd.merge(pd.DataFrame(new_longitude),pd.DataFrame(new_latitude))
new_texts = [plt.text(x_ , y_ , text, fontsize=8) for x_, y_, text in
             zip(new_df['longitude'], new_df['latitude'], new_df['name'])]
# 導(dǎo)出shapefile
output.to_file('output/地震帶.shp')
plt.show()
創(chuàng)建緩沖區(qū)、多環(huán)緩沖區(qū)

實(shí)現(xiàn)代碼:
import os
import shapely
import geopandas as gpd
import matplotlib.pyplot as plt

polygon = shapely.geometry.Polygon([(0, 0), (1, 0), (1, 1), (0, 1)])
# 分別繪制多邊形、多邊形正向緩沖區(qū),坐標(biāo)系是WGS1984,單位是度
cq = gpd.GeoSeries([polygon,
                    polygon.buffer(distance=1),
                    polygon.buffer(distance=3)],
                   crs='EPSG:4326')
# 導(dǎo)出數(shù)據(jù)為shapefile文件
cq.to_file('./output/{}.shp'.format(os.path.basename(__file__).replace('.py', '')),
           driver='ESRI Shapefile',
           encoding='utf-8')
ax = cq.plot(alpha=0.2)
ax.axis('off')  # 取消坐標(biāo)軸的顯示
plt.show()
寫在最后
附相關(guān)完整代碼的下載,還有更多有趣的內(nèi)容,感興趣的朋友們可以自行實(shí)踐。喜歡的朋友們可以點(diǎn)個(gè)關(guān)注,后續(xù)將持續(xù)更新,精彩無限^ - ^
鏈接: https://pan.baidu.com/s/1g7G8sQ17-9XIhojyQ1M7Ww
提取碼: 59vz
最后給大家強(qiáng)烈安利一個(gè)geopandas學(xué)習(xí)博客: https://www.cnblogs.com/feffery/tag/geopandas/
以上就是python geopandas讀取、創(chuàng)建shapefile文件的方法的詳細(xì)內(nèi)容,更多關(guān)于python讀取shapefile文件的資料請(qǐng)關(guān)注腳本之家其它相關(guān)文章!
您可能感興趣的文章:- Python Pandas分組聚合的實(shí)現(xiàn)方法
- python中pandas對(duì)多列進(jìn)行分組統(tǒng)計(jì)的實(shí)現(xiàn)
- 詳解python pandas 分組統(tǒng)計(jì)的方法
- Python Pandas實(shí)現(xiàn)數(shù)據(jù)分組求平均值并填充nan的示例
- Python學(xué)習(xí)筆記之pandas索引列、過濾、分組、求和功能示例
- Python Pandas的簡(jiǎn)單使用教程
- Python pandas入門系列之眾數(shù)和分位數(shù)
- Python pandas求方差和標(biāo)準(zhǔn)差的方法實(shí)例
- 使用Python pandas讀取CSV文件應(yīng)該注意什么?
- 利用python Pandas實(shí)現(xiàn)批量拆分Excel與合并Excel
- python pandas分組聚合詳細(xì)