1. Prometheus 介紹
Prometheus是一套開源的系統(tǒng)監(jiān)控報警框,相比Nagios或者Zabbix擁有如下優(yōu)點
1.1 易管理性
Prometheus: Prometheus核心部分只有一個單獨的二進制文件,可直接在本地工作,不依賴于分布式存儲。
1.2 業(yè)務數(shù)據(jù)相關性
Prometheus:監(jiān)控服務的運行狀態(tài),基于Prometheus豐富的Client庫,用戶可以輕松的在應用程序中添加對Prometheus的支持,從而讓用戶可以獲取服務和應用內部真正的運行狀態(tài)。
1.3 高效:
單一Prometheus可以處理數(shù)以百萬的監(jiān)控指標;每秒處理數(shù)十萬的數(shù)據(jù)點。
1.4 易于伸縮:
通過使用功能分區(qū)(sharing)+聯(lián)邦集群(federation)可以對Prometheus進行擴展,形成一個邏輯集群;Prometheus提供多種語言的客戶端SDK,這些SDK可以快速讓應用程序納入到Prometheus的監(jiān)控當中。
1.5 良好的可視化:
Prometheus除了自帶有Prometheus UI,Grafana可視化工具也提供了完整的Proetheus支持
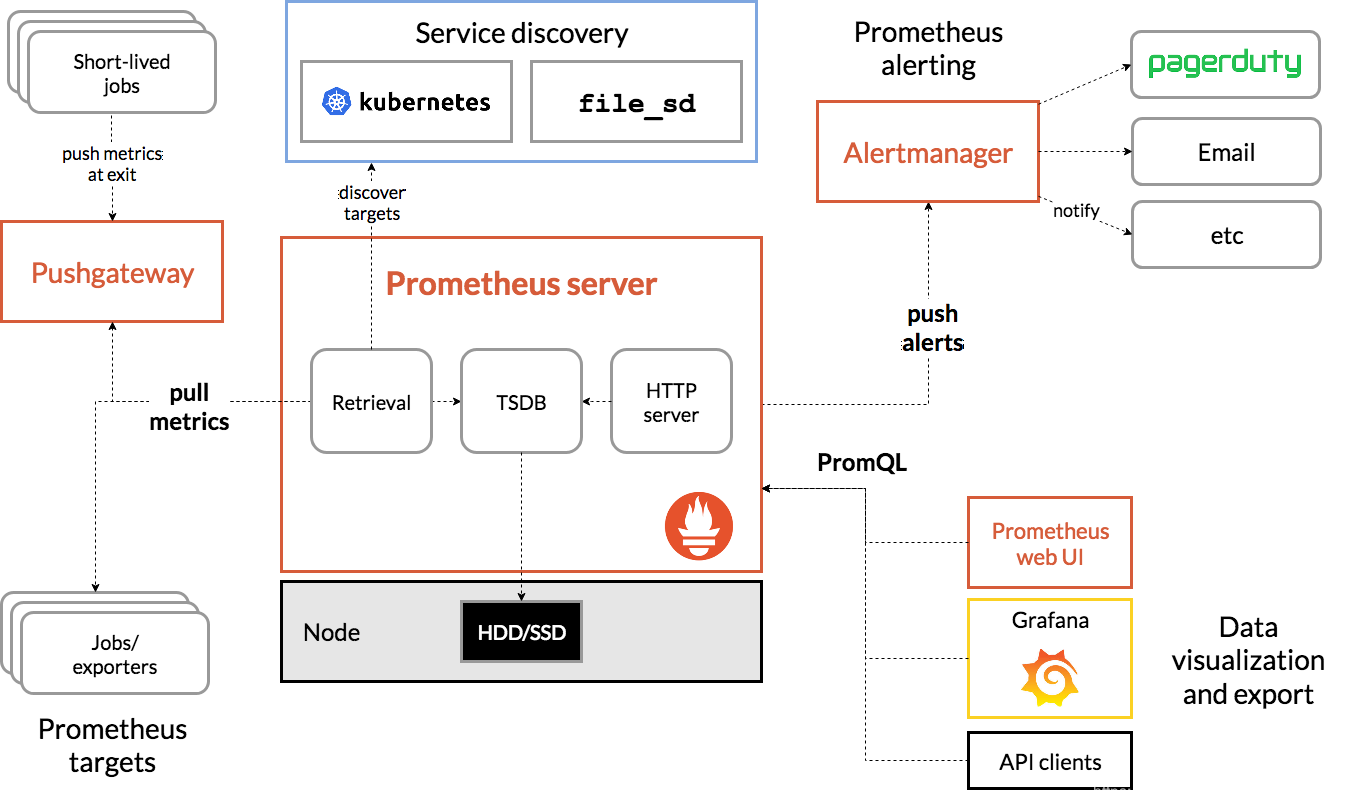
2. Prometheus 框架圖
3. Prometheus 組件介紹
3.1 Prometheus Server:
Prometheus Sever是Prometheus組件中的核心部分,負責實現(xiàn)對監(jiān)控數(shù)據(jù)的獲取,存儲及查詢。Prometheus Server可以通過靜態(tài)配置管理監(jiān)控目標,也可以配合使用Service Discovery的方式動態(tài)管理監(jiān)控目標,并從這些監(jiān)控目標中獲取數(shù)據(jù)。其次Prometheus Sever需要對采集到的數(shù)據(jù)進行存儲,Prometheus Server本身就是一個實時數(shù)據(jù)庫,將采集到的監(jiān)控數(shù)據(jù)按照時間序列的方式存儲在本地磁盤當中。Prometheus Server對外提供了自定義的PromQL,實現(xiàn)對數(shù)據(jù)的查詢以及分析。另外Prometheus Server的聯(lián)邦集群能力可以使其從其他的Prometheus Server實例中獲取數(shù)據(jù)。
3.2 Exporters:
Exporter將監(jiān)控數(shù)據(jù)采集的端點通過HTTP服務的形式暴露給Prometheus Server,Prometheus Server通過訪問該Exporter提供的Endpoint端點,即可以獲取到需要采集的監(jiān)控數(shù)據(jù)。可以將Exporter分為2類:
直接采集:這一類Exporter直接內置了對Prometheus監(jiān)控的支持,比如cAdvisor,Kubernetes,Etcd,Gokit等,都直接內置了用于向Prometheus暴露監(jiān)控數(shù)據(jù)的端點。
間接采集:原有監(jiān)控目標并不直接支持Prometheus,因此需要通過Prometheus提供的Client Library編寫該監(jiān)控目標的監(jiān)控采集程序。例如:Mysql Exporter,JMX Exporter,Consul Exporter等。
3.3 AlertManager:
在Prometheus Server中支持基于Prom QL創(chuàng)建告警規(guī)則,如果滿足Prom QL定義的規(guī)則,則會產生一條告警。在AlertManager從 Prometheus server 端接收到 alerts后,會進行去除重復數(shù)據(jù),分組,并路由到對收的接受方式,發(fā)出報警。常見的接收方式有:電子郵件,pagerduty,webhook 等。
3.4 PushGateway:
Prometheus數(shù)據(jù)采集基于Prometheus Server從Exporter pull數(shù)據(jù),因此當網(wǎng)絡環(huán)境不允許Prometheus Server和Exporter進行通信時,可以使用PushGateway來進行中轉。通過PushGateway將內部網(wǎng)絡的監(jiān)控數(shù)據(jù)主動Push到Gateway中,Prometheus Server采用針對Exporter同樣的方式,將監(jiān)控數(shù)據(jù)從PushGateway pull到Prometheus Server。
4. Prometheus的工作流:
4.1 Prometheus server定期從配置好的jobs或者exporters中拉取metrics,或者接收來自 Pushgateway發(fā)送過來的metrics,或者從其它的Prometheus server中拉metrics。
4.2 Prometheus server在本地存儲收集到的metrics,并運行定義好的alerts.rules,記錄新的時間序列或者向Alert manager推送警報。
4.3 Alertmanager根據(jù)配置文件,對接收到的警報進行處理,發(fā)出告警。
4.4 在圖形界面中,可視化采集數(shù)據(jù)。
到此這篇關于一文秒懂Prometheus 介紹及工作原理的文章就介紹到這了,更多相關Prometheus 介紹及工作原理內容請搜索腳本之家以前的文章或繼續(xù)瀏覽下面的相關文章希望大家以后多多支持腳本之家!
您可能感興趣的文章:- Prometheus的安裝和配置教程詳解
- Prometheus 入門教程之SpringBoot 實現(xiàn)自定義指標監(jiān)控
- Prometheus開發(fā)中間件Exporter過程詳解
- 如何基于Python和Flask編寫Prometheus監(jiān)控
- Prometheus 整合 AlertManager的教程詳解
- prometheus監(jiān)控springboot應用簡單使用介紹詳解
- 利用Prometheus與Grafana對Mysql服務器的性能監(jiān)控詳解