在具體數據的選取上,我爬取的是各省份降水量實時數據
話不多說,開始實操
正文
1.爬取數據
- 使用python爬蟲,爬取中國天氣網各省份24時整點氣象數據
- 由于降水量為動態數據,以js形式進行存儲,故采用selenium方法經xpath爬取數據—ps:在進行數據爬取時,最初使用的方法是漂亮湯法(beautifulsoup)法,但當輸出爬取的內容(class = split>時,卻空空如也。在源代碼界面Ctrl+Shift+F搜索后也無法找到降水量,后查詢得知此為動態數據,無法用該方法進行爬取
- 使用循環和分類的方式爬取省份不同、網址相似的降水量數據,順帶記錄數據對應的城市
f—string:
url_a= f'http://www.weather.com.cn/weather1dn/101{a}0101.shtml'
f-string 用大括號 {} 表示被替換字段,其中直接填入替換內容
將城市和降水量相對應后存入字典再打印
代碼:
from lxml import etree
from selenium import webdriver
import re
city = [''for n in range(34)]   #存放城市列表
rain = [''for n in range(34)]   #存放有關降雨量信息的數值
rain_item = []
driver = webdriver.Chrome(executable_path='chromedriver')   #使用chrome瀏覽器打開
for a in range(1,5):      #直轄市數據
    url_a= f'http://www.weather.com.cn/weather1dn/1010{a}0100.shtml'  #網址
    driver.get(url_a)    #打開網址
    rain_list = []
    city_list = []
    resp_text = driver.page_source
    page_html = etree.HTML(resp_text)
    city_list = page_html.xpath('/html/body/div[4]/div[2]/a')[0]    #通過xpath爬取城市名稱
    rain_list = page_html.xpath('//*[@id="weatherChart"]/div[2]/p[5]')[0]   #通過xpath爬取降雨量數據
    city[a-1] = city_list.text  #存入城市列表
    rain[a-1] = re.findall(r"\d+\.?\d*",rain_list.text)[0] #存入數值
for a in range(5,10):      #一位數字網址數據
    url_a= f'http://www.weather.com.cn/weather1dn/1010{a}0101.shtml'
    driver.get(url_a)
    rain_list = []
    city_list = []
    resp_text = driver.page_source
    page_html = etree.HTML(resp_text)
    city_list = page_html.xpath('/html/body/div[4]/div[2]/a')[0]    #通過xpath爬取城市名稱
    rain_list = page_html.xpath('//*[@id="weatherChart"]/div[2]/p[5]')[0]   #通過xpath爬取降雨量數據
    city[a-1] = city_list.text     #存入城市列表
    rain[a-1] = re.findall(r"\d+\.?\d*",rain_list.text)[0] #存入數值
for a in range(10,35):      #二位數字網址數據
    url_a= f'http://www.weather.com.cn/weather1dn/101{a}0101.shtml'
    driver.get(url_a)
    rain_list = []
    city_list = []
    resp_text = driver.page_source
    page_html = etree.HTML(resp_text)
    city_list = page_html.xpath('/html/body/div[4]/div[2]/a')[0]    #通過xpath爬取城市名稱
    rain_list = page_html.xpath('//*[@id="weatherChart"]/div[2]/p[5]')[0]   #通過xpath爬取降雨量數據
    city[a-1] = city_list.text  #存入城市列表
    rain[a-1] = re.findall(r"\d+\.?\d*",rain_list.text)[0] #存入數值
d = dict(zip(city,rain))  #將城市和降水量的列表合成為字典
for k,v in d.items():  #str轉float類型
    rain_item.append(float(v))
print(d)
在對爬取的內容進行處理時,可能會因為數據的類型而報錯,如爬下來的數據為str類型,而排序需要數字類型,故需要進行float類型轉化
使用該爬取方法,是模擬用戶打開網頁,并且會在電腦上進行顯示。在爬取實驗進行中途,中國天氣網進行了網址更新,原網址出現了部分城市數據無法顯示的問題,但當刷新界面后,數據可正常顯示,此時可采用模擬鼠標點擊刷新的方法避免錯誤。由于后續找到了新網址,故將這一方法省去。
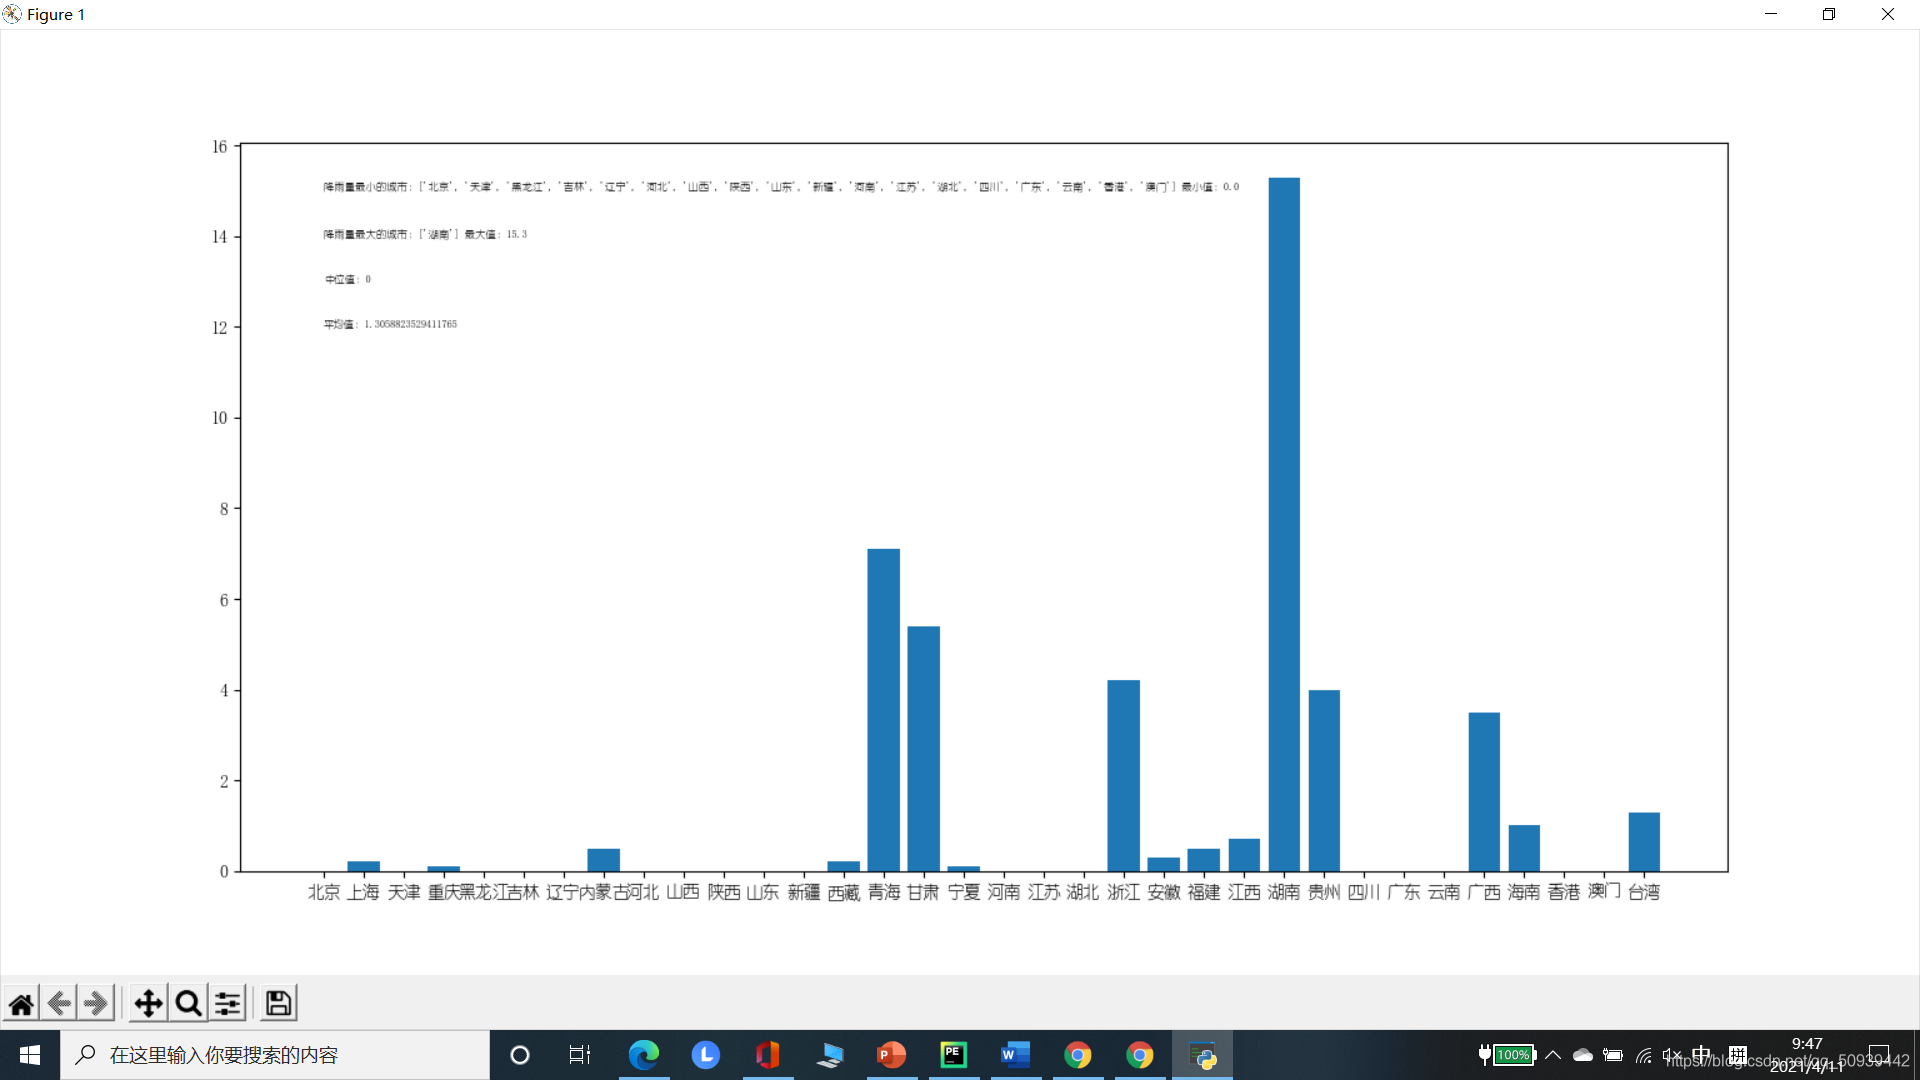
2.數據可視化
- 用Matplotlib庫函數繪制曲線,并輸出最大值及相應城市、最小值及相應城市、平均值和中位值
- 數據的確定:medium分奇偶計算中位值所處排序后數據的位置(中位值);用sum求和后除于數據個數(平均值);max和min函數找到最值再由數值經循環找到對應的城市列表
- 繪圖:使用plt函數繪制圖像,并注明橫縱坐標、所需注釋
- 文本處理:在進行注釋時,plt函數所要求的格式為str類型,故需要進行類型轉換,同時添加適當文字說明
代碼:
#-*- codeing = utf-8 -*-
import matplotlib.pyplot as plt
from lxml import etree
from selenium import webdriver
import re
import matplotlib
matplotlib.rc("font",family='YouYuan')
city = [''for n in range(34)]   #存放城市列表
rain = [''for n in range(34)]   #存放有關降雨量信息的數值
driver = webdriver.Chrome(executable_path='chromedriver')   #使用chrome瀏覽器打開
for a in range(1,5):      #直轄市數據
    url_a= f'http://www.weather.com.cn/weather1dn/1010{a}0100.shtml'  #網址
    driver.get(url_a)    #打開網址
    rain_list = []
    city_list = []
    resp_text = driver.page_source
    page_html = etree.HTML(resp_text)
    city_list = page_html.xpath('/html/body/div[4]/div[2]/a')[0]    #通過xpath爬取城市名稱
    rain_list = page_html.xpath('//*[@id="weatherChart"]/div[2]/p[5]')[0]   #通過xpath爬取降雨量數據
    city[a-1] = city_list.text  #存入城市列表
    rain[a-1] = re.findall(r"\d+\.?\d*",rain_list.text)[0] #存入數值
for a in range(5,10):      #非直轄一位數字網址數據
    url_a= f'http://www.weather.com.cn/weather1dn/1010{a}0101.shtml'
    driver.get(url_a)
    rain_list = []
    city_list = []
    resp_text = driver.page_source
    page_html = etree.HTML(resp_text)
    city_list = page_html.xpath('/html/body/div[4]/div[2]/a')[0]    #通過xpath爬取城市名稱
    rain_list = page_html.xpath('//*[@id="weatherChart"]/div[2]/p[5]')[0]   #通過xpath爬取降雨量數據
    city[a-1] = city_list.text  #存入城市列表
    rain[a-1] = re.findall(r"\d+\.?\d*",rain_list.text)[0] #存入數值
for a in range(10,35):      #非直轄二位數字網址數據
    url_a= f'http://www.weather.com.cn/weather1dn/101{a}0101.shtml'
    driver.get(url_a)
    rain_list = []
    city_list = []
    resp_text = driver.page_source
    page_html = etree.HTML(resp_text)
    city_list = page_html.xpath('/html/body/div[4]/div[2]/a')[0]    #通過xpath爬取城市名稱
    rain_list = page_html.xpath('//*[@id="weatherChart"]/div[2]/p[5]')[0]   #通過xpath爬取降雨量數據
    city[a-1] = city_list.text  #存入城市列表
    rain[a-1] = re.findall(r"\d+\.?\d*",rain_list.text)[0] #存入數值
if len(rain)%2 == 0:        #尋找中值
    medium = int(len(rain)/2)
else:
    medium = int(len(rain)/2)+1
medium_text = "中位值:" + rain[medium]
d = dict(zip(city,rain))  #將城市和降水量的列表合成為字典
rain_item = []
city_min = []
city_max = []
for k,v in d.items():
    rain_item.append(float(v))
average_rain = sum(rain_item)/len(rain_item)
average_text = "平均值:"+ str(average_rain)
max_rain = max(rain_item)  #最大值
min_rain = min(rain_item)  #最小值
for k,v in d.items():
    if float(v) == min_rain:
        city_min.append(k)
min_text = "降雨量最小的城市:"+str(city_min)+" 最小值:"+str(min_rain)
for k,v in d.items():
    if float(v) ==max_rain:
        city_max.append(k)
max_text = "降雨量最大的城市:"+str(city_max)+" 最大值:"+str(max_rain)
plt.bar(range(len(d)), rain_item, align='center')
plt.xticks(range(len(d)), list(d.keys()))
plt.xlabel('城市',fontsize=20)
plt.ylabel('降水量',fontsize=20)
plt.text(0,12,average_text,fontsize=6)
plt.text(0,13,medium_text,fontsize=6)
plt.text(0,14,max_text,fontsize=6)
plt.text(0,15,min_text,fontsize=6)
plt.show()
2.運行界面
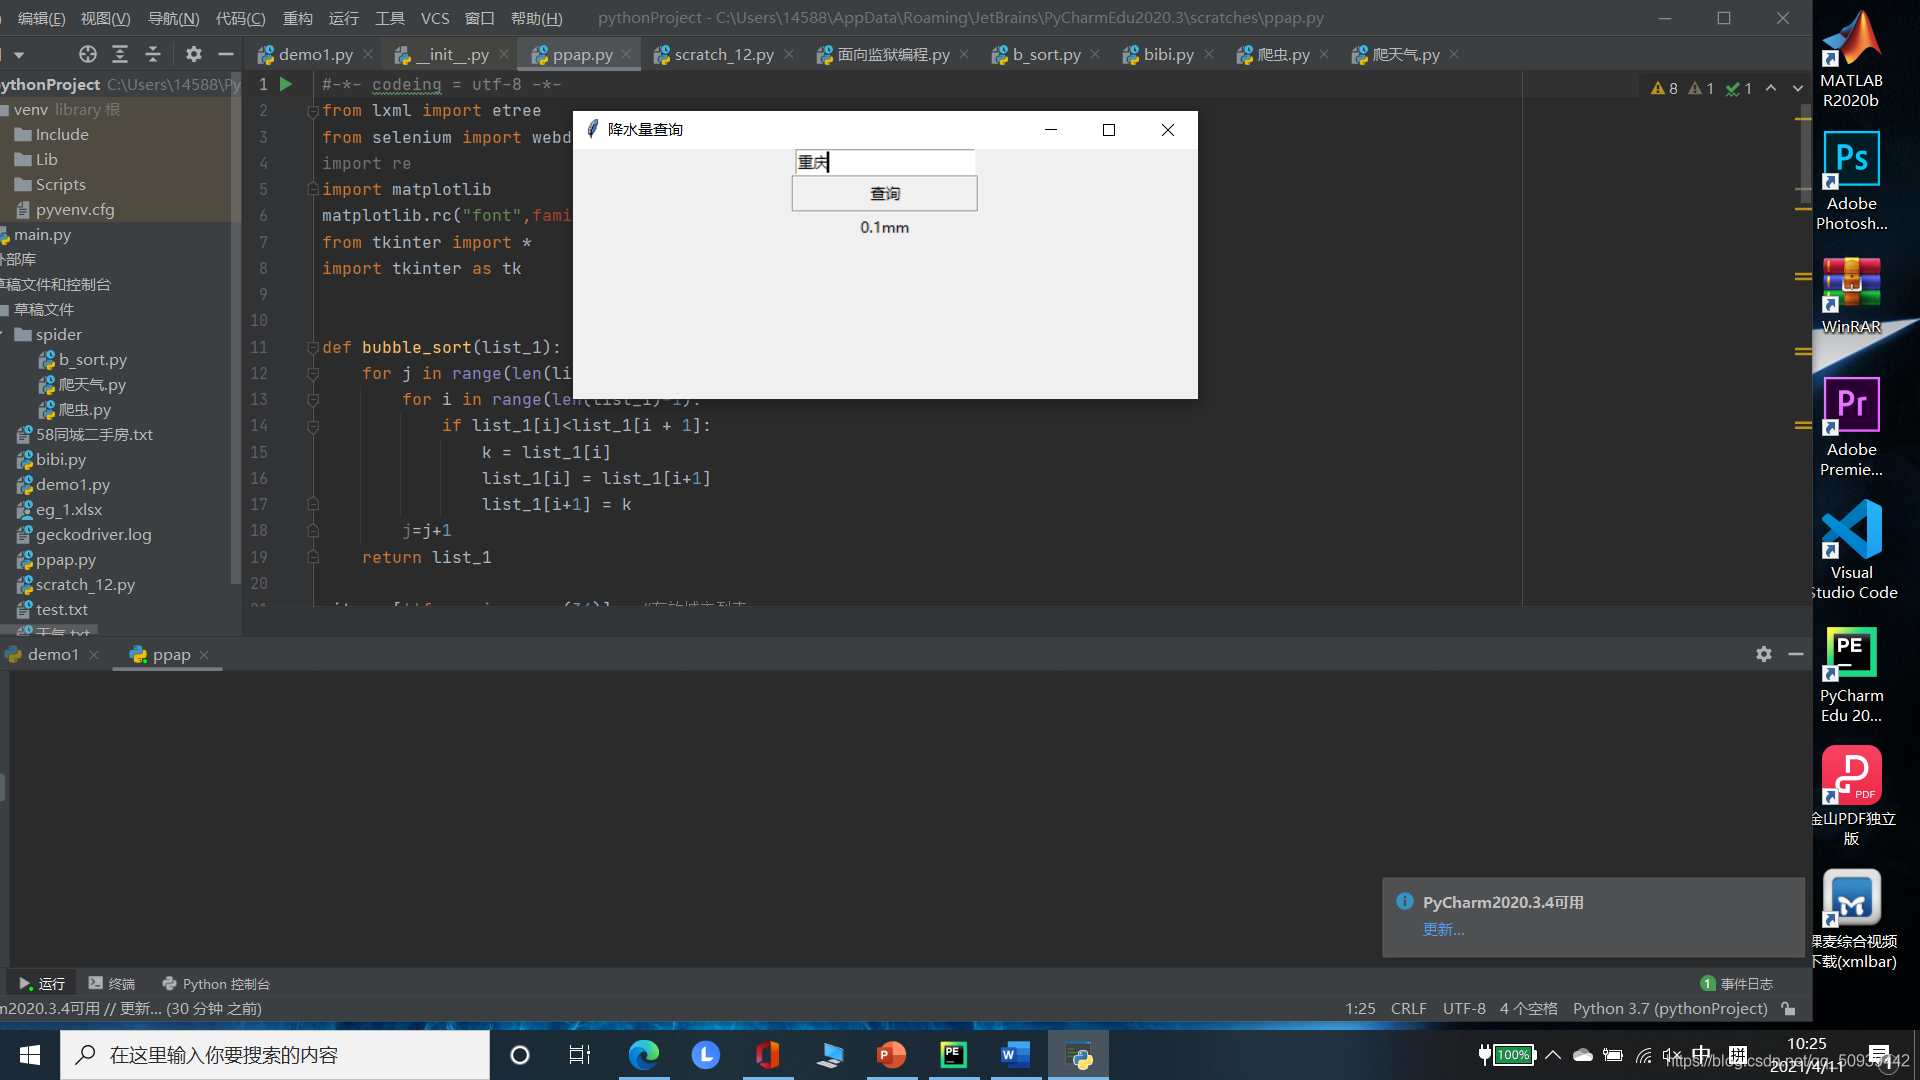
3.互動界面
使用tkinter庫進行GUI的構建使用button函數實現交互,調用編寫的get函數獲取對用戶輸入的內容進行獲取并使用循環進行遍歷處理,若城市輸入正確,則在界面上輸出當地的降水量代碼:
#-*- codeing = utf-8 -*-
from lxml import etree
from selenium import webdriver
import re
import matplotlib
matplotlib.rc("font",family='YouYuan')
from tkinter import *
import tkinter as tk
city = [''for n in range(34)]   #存放城市列表
rain = [''for n in range(34)]   #存放有關降雨量信息的數值
driver = webdriver.Chrome(executable_path='chromedriver')   #使用chrome瀏覽器打開
for a in range(1,5):      #直轄市數據
    url_a= f'http://www.weather.com.cn/weather1dn/1010{a}0100.shtml'  #網址
    driver.get(url_a)    #打開網址
    rain_list = []
    city_list = []
    resp_text = driver.page_source
    page_html = etree.HTML(resp_text)
    city_list = page_html.xpath('/html/body/div[4]/div[2]/a')[0]    #通過xpath爬取城市名稱
    rain_list = page_html.xpath('//*[@id="weatherChart"]/div[2]/p[5]')[0]   #通過xpath爬取降雨量數據
    city[a-1] = city_list.text  #存入城市列表
    rain[a-1] = re.findall(r"\d+\.?\d*",rain_list.text)[0] #存入數值
for a in range(5,10):      #非直轄一位數字網址數據
    url_a= f'http://www.weather.com.cn/weather1dn/1010{a}0101.shtml'
    driver.get(url_a)
    rain_list = []
    city_list = []
    resp_text = driver.page_source
    page_html = etree.HTML(resp_text)
    city_list = page_html.xpath('/html/body/div[4]/div[2]/a')[0]    #通過xpath爬取城市名稱
    rain_list = page_html.xpath('//*[@id="weatherChart"]/div[2]/p[5]')[0]   #通過xpath爬取降雨量數據
    city[a-1] = city_list.text  #存入城市列表
    rain[a-1] = re.findall(r"\d+\.?\d*",rain_list.text)[0] #存入數值
for a in range(10,35):      #非直轄二位數字網址數據
    url_a= f'http://www.weather.com.cn/weather1dn/101{a}0101.shtml'
    driver.get(url_a)
    rain_list = []
    city_list = []
    resp_text = driver.page_source
    page_html = etree.HTML(resp_text)
    city_list = page_html.xpath('/html/body/div[4]/div[2]/a')[0]    #通過xpath爬取城市名稱
    rain_list = page_html.xpath('//*[@id="weatherChart"]/div[2]/p[5]')[0]   #通過xpath爬取降雨量數據
    city[a-1] = city_list.text  #存入城市列表
    rain[a-1] = re.findall(r"\d+\.?\d*",rain_list.text)[0] #存入數值
d = dict(zip(city,rain))  #將城市和降水量的列表合成為字典
root=tk.Tk()
root.title('降水量查詢')
root.geometry('500x200')
def get():
    values = entry.get()
    for k,v in d.items():
        if k == values:
            label = Label(root, text= v+'mm')
            label.pack()
frame = Frame(root)
frame.pack()
u1 = tk.StringVar()
entry = tk.Entry(frame, width=20, textvariable=u1,  relief="sunken")
entry.pack(side="left")
frame1 = Frame(root)
frame1.pack()
btn1=Button(frame1, text="查詢", width=20, height=1, relief=GROOVE, command=lambda :get())
btn1.pack(side="left")
root.mainloop()
4.運行界面
寫在最后
在爬取天氣的過程中,僅發現中國天氣網有各省份降水量的數據,可見我國在數據開源方面還有很長的路要走
到此這篇關于python爬取各省降水量及可視化詳解的文章就介紹到這了,更多相關python爬取請搜索腳本之家以前的文章或繼續瀏覽下面的相關文章,希望大家以后多多支持腳本之家!
您可能感興趣的文章:- Python編寫可視化界面的全過程(Python+PyCharm+PyQt)
- Python實現K-means聚類算法并可視化生成動圖步驟詳解
- python數據分析之員工個人信息可視化
- 關于Python可視化Dash工具之plotly基本圖形示例詳解
- python用pyecharts實現地圖數據可視化
- Python繪制K線圖之可視化神器pyecharts的使用
- Python繪制詞云圖之可視化神器pyecharts的方法
- python 可視化庫PyG2Plot的使用
- Python數據分析之彩票的歷史數據
- Python 數據分析之逐塊讀取文本的實現
- Python數據分析庫pandas高級接口dt的使用詳解
- Python Pandas數據分析工具用法實例
- 用Python 爬取貓眼電影數據分析《無名之輩》
- 大數據分析用java還是Python
- python 數據分析實現長寬格式的轉換
- PyCharm設置Ipython交互環境和宏快捷鍵進行數據分析圖文詳解
- Python實戰之疫苗研發情況可視化